Introduction
Baidu Inc. is a prominent Chinese multinational technology company, widely recognized as one of the world’s leading artificial intelligence (AI) and internet services providers. Headquartered in Beijing, Baidu is best known for operating China’s largest search engine, but its portfolio spans a broad range of sectors, including cloud computing, autonomous driving, language processing, and smart devices.

Illustration 1: The Baidu logo, featuring its distinctive pawprint symbol, representing its digital footprint and innovation.
Unlike many global tech giants that emerged from the West, Baidu has played a foundational role in shaping the Chinese internet landscape. Its search engine dominates the domestic market, while its ongoing investment in AI and machine learning has positioned the company as a key innovator in emerging technologies such as autonomous vehicles and natural language understanding.
As a member of China’s “BAT” trio (Baidu, Alibaba, Tencent), Baidu is one of the most influential tech companies in Asia. Its technological infrastructure powers a wide array of services, including Baidu Maps, Baidu Cloud, and DuerOS—a voice assistant platform integrated into various smart devices. With a strong focus on AI research, a deep data ecosystem, and strategic partnerships, Baidu continues to be a driving force in the global tech landscape, particularly in AI and intelligent mobility.
History
Baidu was founded in 2000 by Robin Li and Eric Xu, emerging at a time when China’s internet ecosystem was still in its infancy. Robin Li’s development of the RankDex site-scoring algorithm in the late 1990s laid the foundation for Baidu’s core search technology—a precursor to modern search engine optimization and ranking systems.
Baidu’s breakthrough came in the early 2000s as it rapidly became China’s dominant search engine, offering results tailored to Chinese-language users with superior indexing of Chinese websites. The company’s innovative pay-for-placement advertising model helped generate significant early revenue, setting the stage for rapid growth and public listing on the NASDAQ in 2005.
Throughout the 2010s, Baidu evolved from a search engine company into a diversified tech powerhouse. It expanded into cloud services, digital maps, mobile applications, and AI-powered products. A major turning point was its strategic pivot toward artificial intelligence—investing heavily in autonomous driving (Apollo), smart voice assistants (DuerOS), and deep learning platforms (PaddlePaddle), making AI central to its long-term vision.
By the 2020s, Baidu had positioned itself as a global leader in AI and autonomous technology. Its Apollo platform became one of the most advanced autonomous driving systems in the world, and Baidu began operating robotaxi services in several Chinese cities. The company also deepened its AI capabilities through Baidu Brain, a large-scale AI system integrating vision, speech, knowledge, and language technologies.
Today, Baidu remains one of China’s most influential technology companies. With a strong emphasis on innovation, research, and ethical AI development, Baidu continues to drive advancements across industries. In the stock market, Baidu is seen as a bellwether for the Chinese tech sector, reflecting broader trends in AI, cloud computing, and digital infrastructure.
Operations and Products
- Search, Cloud, and AI-Driven Ecosystem
Baidu operates one of the world’s largest and most advanced AI-powered ecosystems, built on a foundation of search, cloud computing, and intelligent services. While the company began as China’s premier internet search engine, it has transformed into a diversified technology enterprise focused on artificial intelligence, autonomous driving, cloud services, and smart devices.
Baidu’s core products still include its flagship Baidu Search, which dominates the Chinese-language internet search market. Over time, this platform has evolved with advanced AI features such as voice search, natural language processing (NLP), and personalized results based on big data analytics.
Illustration 2: Baidu Search is the product Baidu is most famous for.
Beyond search, Baidu Cloud delivers enterprise-grade infrastructure and intelligent services, including AI-powered data analytics, intelligent speech and image recognition, and machine learning platforms. This cloud ecosystem serves sectors like finance, healthcare, manufacturing, and smart cities.
- Autonomous Driving and Smart Transportation
One of Baidu’s most prominent innovations is Apollo, its open-source autonomous driving platform. Apollo provides a comprehensive solution for autonomous vehicle development, including software stacks, cloud-based simulation tools, and in-vehicle operating systems. The platform is used by global automakers and has powered the launch of robotaxi services in cities like Beijing, Wuhan, and Chongqing.

Illustration 3: One of Baidu’s Apollo robotaxies
In addition to Apollo, Baidu has introduced RT6, a fully autonomous electric vehicle designed for urban ride-hailing, marking a step forward in reducing operational costs and scaling autonomous mobility.
- Voice Assistants and Smart Devices
Baidu’s AI assistant DuerOS powers a growing range of smart devices, from smart speakers and in-car infotainment systems to household appliances. Through natural language processing and conversational AI, DuerOS enables hands-free interaction and integration with Baidu’s services.
The company has also developed AI chips, such as Kunlun, to support high-performance AI processing for applications in data centers and on edge devices. These chips are used for deep learning, image and speech recognition, and autonomous driving computation.
- Emerging Technologies and Future Focus
Baidu is investing heavily in generative AI, foundation models, and language-based applications. Its ERNIE (Enhanced Representation through Knowledge Integration) model is China’s counterpart to GPT-like large language models, enabling everything from AI writing and coding to intelligent customer service and enterprise automation.
Looking ahead, Baidu is positioning itself as a global AI leader, with a focus on AI cloud integration, smart transportation infrastructure, and intelligent edge computing. Its commitment to ethical AI, energy efficiency, and open-source collaboration ensures its relevance in both China’s tech ecosystem and the broader international market.
Key Competitors
Baidu operates in several fast-evolving and highly competitive sectors, including internet services, artificial intelligence, cloud computing, and autonomous driving. Its major competitors vary by product category and technological focus:
Alibaba Group – As one of China’s largest tech conglomerates, Alibaba competes with Baidu primarily in cloud computing and AI services. Alibaba Cloud is a top rival to Baidu Cloud, offering a wide range of infrastructure and machine learning tools to enterprise clients. Alibaba also invests heavily in smart city and AI-driven business applications.
Tencent – Known for WeChat and its expansive digital ecosystem, Tencent competes with Baidu in the realms of online advertising, content distribution, and AI-powered applications. Tencent’s investments in cloud computing, search, and smart services overlap with Baidu’s broader AI ecosystem.
ByteDance – While originally known for its short-form video platforms like TikTok (Douyin in China), ByteDance has become a formidable competitor in AI and online search. Its Toutiao news aggregation platform and growing ambitions in AI research present a challenge to Baidu’s dominance in content discovery and recommendation systems.
Huawei – Huawei competes with Baidu in AI chips, cloud services, and smart infrastructure. The company’s Ascend AI processors and Huawei Cloud offerings rival Baidu’s Kunlun chips and cloud-based AI solutions. Huawei is also a major player in intelligent transportation, overlapping with Baidu’s Apollo platform.

Illustration 4: Baidu Headquarters in Beijing China
Google (Alphabet Inc.) – On the international stage, Google is Baidu’s most direct analogue, especially in search, cloud, and AI research. While Google does not operate in mainland China due to regulatory constraints, both companies compete globally in areas such as large language models, autonomous driving, and AI-powered cloud services.
Competitive Advantage
Baidu’s most significant competitive advantage lies in its deep expertise and long-standing investment in artificial intelligence (AI). As one of the first Chinese tech companies to prioritize AI as a core strategy, Baidu has built a vertically integrated AI ecosystem that spans foundational research, infrastructure, and practical applications. Its proprietary ERNIE large language model and AI framework PaddlePaddle give Baidu full-stack control over its AI pipeline, from model training to deployment—similar to how a vertically integrated chipmaker controls the semiconductor process. This in-house AI capability enables Baidu to quickly adapt and deploy solutions across sectors such as search, cloud computing, autonomous driving, and smart devices, giving it a strong edge over companies that rely on third-party models or external development frameworks.
Another competitive strength is Baidu’s autonomous driving platform, Apollo, which is widely regarded as one of the world’s most advanced open-source ecosystems for intelligent mobility. With partnerships across the automotive industry and active robotaxi deployments in multiple Chinese cities, Baidu has a first-mover advantage in the smart transportation space.
Baidu also benefits from its dominance in Chinese-language search and knowledge-based services. Its search engine remains the market leader in China, supported by AI-enhanced features and deep content integration through platforms like Baidu Baike (an online encyclopedia) and Baidu Tieba (a discussion forum network). These platforms give Baidu access to vast amounts of first-party data, enabling superior personalization, ad targeting, and machine learning performance.
Additionally, Baidu’s emphasis on data security, localization, and regulatory alignment gives it an operational advantage in China’s tightly regulated digital environment. The company’s strong government relations and commitment to compliance enable it to operate at scale in areas where foreign tech giants face barriers.
Finally, Baidu’s strong R&D culture, with continuous investment in AI chips (e.g., Kunlun) and next-gen computing, ensures its long-term competitiveness. Combined with a robust cloud infrastructure, a growing enterprise customer base, and integrated smart services, Baidu is uniquely positioned to lead China’s digital transformation and compete globally in AI-driven technologies.

Illustration 5: A Baidu AI robot
Future Outlook
Baidu is expected to see steady growth as demand rises for smart mobility, cloud services, and intelligent digital tools in China. Sectors like autonomous driving, enterprise cloud solutions, and digital infrastructure are projected to expand, creating new opportunities for the company.
With ongoing investment in self-driving technology (Apollo), custom chips (Kunlun), and industry-focused cloud services, Baidu is well-placed to benefit from China’s push toward automation and digitalization. As these trends continue, demand for Baidu’s core services is likely to increase in the years ahead.
Stock Analysis
In this section we will analyze Baidu’s stock to see if it is a good stock to buy or not. Our philosophy is value investing meaning that we try to find good quality companies that are undervalued. However, we will give a holistic overview so all kind of investors with different philosophies can judge the stock for themselves.
Revenue and Profits


Illustration 6 and 7: Revenue of Baidu from 2009 to 2024
As shown in Illustration 6 and 7, Baidu has experienced a dynamic long-term revenue trajectory, particularly from 2009 to 2021, when it established itself as China’s dominant search engine and a major player in online advertising. The company’s early lead in China’s digital economy, supported by rapid internet adoption and growing advertiser demand, helped drive consistent gains throughout much of this period. Baidu also began investing in emerging technologies during these years, including artificial intelligence, autonomous driving, and cloud services, laying the groundwork for future diversification.
However, despite these early advantages, Baidu encountered periods of slower growth and revenue pressure, notably between 2021 and 2024. This downturn was driven by intensifying competition from platforms like Tencent and Bytedance, shifts in user behavior toward mobile super apps and short-form video, and internal restructuring. In response, Baidu expanded its R&D spending and began repositioning itself as a technology-driven company beyond search, focusing on AI cloud computing, Apollo (autonomous driving), and smart devices. The role of coid-19 on the very strong revenue increase is also worth taking in to consideration.
Baidu’s revenue is overall a green flag as it shows a steady increase in income over time and also reflects the company’s ability to adapt through diversification into AI, cloud, and autonomous driving, positioning it well for future growth despite short-term volatility.


Illustration 8 and 9: Net Income for Baidu from 2009 to 2024
Net income is a crucial metric to evaluate when determining whether a company is a worthwhile investment. It represents a company’s net profit or loss after accounting for all revenues, income items, and expenses, calculated as Net Income = Revenue – Expenses.
As can be seen from Illustration 8 and 9, the net income for Baidu rose steadily from 2009 to 2015 due to strong performance in its core search and online advertising business. However, from 2015 to 2025, net income has been highly volatile despite steadily increasing revenue. This disconnect is largely due to rising operating costs, heavy R&D investments in AI, autonomous driving, and cloud services, as well as regulatory headwinds and economic uncertainty in China. While revenue growth indicates strong top-line performance, the inconsistency in net income is a red flag, suggesting pressure on margins and highlighting the financial risks tied to Baidu’s aggressive long-term innovation strategy.
Revenue Breakdown

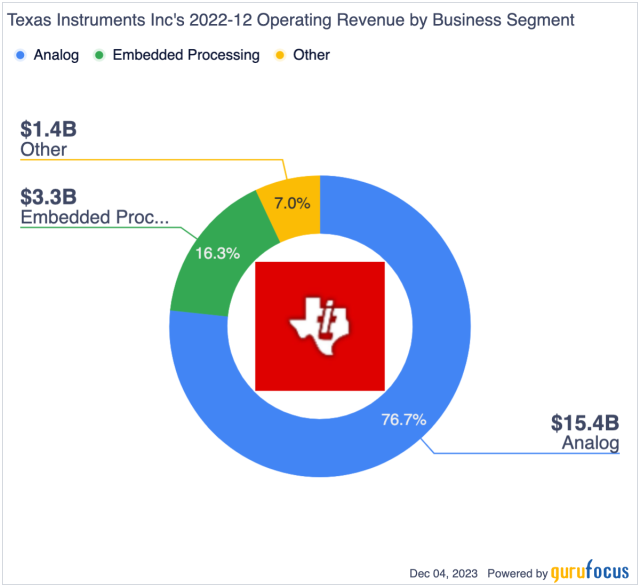
Illustration 10: Revenue Breakdown for Baidu gathered from gurufocus
The Online Marketing segment is Baidu’s largest revenue driver, contributing approximately 60–70% of total revenue. This segment primarily consists of pay-per-click (PPC) advertising services through Baidu’s core search engine platform, as well as display ads across its ecosystem of products and content partners. Despite growing competition from platforms like Tencent and ByteDance, Baidu maintains a strong presence in China’s search-based ad market. However, ad revenue has faced pressure in recent years due to regulatory crackdowns on internet companies, weakening macroeconomic conditions, and advertisers shifting budgets toward e-commerce and short video platforms.
Baidu’s non-advertising revenue—mainly from AI Cloud and intelligent driving—now accounts for approximately 25–30% of total revenue. This segment includes Baidu AI Cloud services, Apollo autonomous driving, Xiaodu smart devices, and intelligent transportation systems. AI Cloud has seen significant growth from government and enterprise demand for digital transformation, while Apollo remains a long-term bet on the future of mobility. These areas have required heavy investment and contributed to margin pressure, but they represent key pillars of Baidu’s strategic pivot beyond advertising. The cloud segment, in particular, has shown strong momentum, with revenue growing over 20% year-over-year in several recent quarters.
The remaining 5–10% of Baidu’s revenue comes from other sources, including content subscriptions, licensing, and miscellaneous services tied to the company’s broader AI ecosystem. While not core drivers of growth, these smaller streams add diversification and support Baidu’s broader goal of becoming a comprehensive AI and technology platform.
Despite this diversification, Baidu has faced financial pressure in recent years. While revenue has continued to rise, net income has been volatile due to high R&D costs, regulatory expenses, and ongoing losses in emerging business units like autonomous driving. For example, Baidu’s net income dropped from RMB 10.2 billion in 2021 to RMB 7.6 billion in 2023, with fluctuations expected to continue as the company scales its next-gen technologies.
As seen in Illustration 13, a significant portion of Baidu’s revenue is allocated to cost of goods sold (COGS), particularly within its cloud and AI-related businesses. Unlike the higher-margin search advertising segment, Baidu’s non-advertising services—such as AI Cloud and smart devices—tend to carry higher operational costs, resulting in a larger share of revenue consumed by COGS. This has put pressure on overall gross margins, especially as these segments expand. Additionally, Baidu consistently allocates over 15% of its revenue to research and development (R&D), reflecting its strategic focus on long-term innovation in AI and autonomous technologies. While these investments are vital for future growth, they contribute to current margin compression and earnings volatility.
Overall, Baidu’s revenue breakdown reflects both stability and transformation. Its dominance in online advertising ensures steady cash flow, while emerging segments in AI and autonomous driving offer promising growth opportunities. However, investors should be aware of the execution risks and earnings volatility that come with this strategic shift.
Earnings per Share (EPS)

Illustration 11: Earnings per share for Baidu from 2009 to 2024
Earnings Per Share (EPS) is a key financial metric that measures a company’s profitability on a per-share basis. It indicates how much profit a company generates for each outstanding share of its stock, and is used to assess a company’s financial health, profitability, and potential for growth. In other words this metric can tell us how profitable the business is.
The EPS figure itself isn’t the primary focus for value investors—it can be 0.2 or 10, but what truly matters is the company’s ability to generate consistent earnings growth. A steadily increasing EPS over time signals strong financial health, profitability, and long-term value creation.
Baidu’ earnings per share (EPS) performance from 2009 to 2015 reflects a generally strong long-term trend, but recent years have shown a concerning volatility as shown in illustration 11. From 2009 to 2015, Baidy consistently grew its EPS, reaching a peak of $16.69 per share in 2015. However, from 2015 onwards, Baidu’s EPS has shown pronounced fluctuations. This volatility has been driven by several factors: intensifying competition from other tech giants, heavy investments in AI and autonomous driving, regulatory pressures within China’s tech sector, and broader macroeconomic uncertainties. While there were periods of recovery and innovation-led growth, the company has struggled to maintain stable profit expansion year-over-year.
This volatility is a red flag for investors, as it indicates that Baidu is struggling to maintain steady profit growth despite its historically strong revenue performance. However, in recent years from 2022 its EPS has been steadily increasing which is a positive sign and shows an ability to grow a profit. Potential Investors should in all case monitor the EPS of Baidu closely for sudden changes.
Assets and Liabilities


Illustration 12 and 13: Assets and Liabilities for Baidu from 2009 to 2024.
When evaluating a company as a potential investment, understanding its assets and liabilities is crucial. If a local business owner offered to sell their shop to you, one of the first questions—after determining its profitability—would be about its equity and assets. The same principle applies when assessing publicly traded companies like Baidu.’
As shown in Illustrations 11 and 12, Texas Instruments has a substantial asset base, totaling $58.6 billion in 2024. This steady asset growth over time from 2009 to 2024 is a positive sign, indicating that the company is expanding its operations, investing in new technologies, and strengthening its market position. A growing asset base often reflects a company’s ability to scale its business, acquire new projects, and improve its production capacity, which is particularly important in the competitive industry Baidu is in.
At the same time, Baidu’s total liabilities have also increased significantly, rising from $0.2 billion in 2009 to $21.1 billion in 2024. While such a sharp rise in debt might raise concerns for some investors, it is not necessarily a red flag given Baidu’s ongoing investments in artificial intelligence, cloud computing, and autonomous driving. These capital-intensive initiatives are essential for maintaining technological leadership in a rapidly evolving landscape. Baidu has historically balanced its investments with a strong focus on innovation and long-term growth, but the rising debt levels warrant careful observation. Investors should closely monitor Baidu’s ability to manage its liabilities effectively, especially amid recent earnings volatility. Ensuring that debt remains manageable and does not hinder future financial stability will be crucial for the company’s long-term success.
The key factor for investors is whether Baidu can effectively manage its debt while maintaining strong revenue and profitability. If the company can generate consistent cash flow and sustain high demand for its products and services, its rising liabilities may not be a major issue. However, if debt levels continue to grow faster than revenue or profits, it could indicate financial strain, making it important for investors to monitor the company’s ability to service its obligations while maintaining profitability.
The cash on hand for Baidu is a green flag for potential investors, as the company has $19 billion in readily available cash as of 2024. This is significantly higher than its long-term debt of $7.1 billion, which indicates a strong liquidity position. This suggests that Baidu is well-equipped to meet its financial obligations, fund strategic investments, and weather short-term market uncertainties without relying heavily on external financing.
As seen in Illustration 13, Total Shareholder Equity—calculated as total assets minus total liabilities—has consistently grown over the past 14 years. This is a positive indicator for potential investors, as it suggests that Baidu is building value over time rather than eroding its financial foundation. A steadily increasing shareholder equity indicates that the company’s assets are growing at a faster rate than its liabilities, which is a green flag for financial health. This trend suggests that Baidu is successfully expanding its operations while maintaining a solid balance sheet. Additionally, rising equity provides a buffer against financial downturns, making the company more resilient in times of economic uncertainty. However, investors should also consider how this growth is achieved—whether through profitable operations or increased debt financing—to fully assess the sustainability of this trend.
Debt to Equity Ratio


Illustration 14 and 15: Debt tp Equity ratio of Baidu from 2009 to 2024
The Debt-to-Equity (D/E) ratio is an important financial metric for assessing a company’s financial leverage and risk. It compares the amount of debt the company uses to finance its operations relative to its shareholder equity. A high D/E ratio suggests that the company relies more heavily on debt to fuel growth, which could increase financial risk, especially during economic downturns when managing debt obligations becomes more challenging. In contrast, a lower D/E ratio indicates that the company is primarily financed through equity, reducing financial risk but potentially limiting its ability to rapidly expand.
Legendary value investor Warren Buffett generally prefers a ratio below 0.5. Baidu’s D/E ratio is currently above that, standing at approximately 0.61 as of 2024 which is not much especially considering all the new AI projects Baidu has started in recent years. The D/E has steadily increased from 2009 where it was just 0.25. This indicates a growing reliance on debt financing over the past decade. This rising trend could raise concerns about Baidu’s financial leverage and its ability to manage debt effectively, especially in a volatile regulatory and competitive environment. However, this is not necessarily a red flag as Baidu has been investing in more AI projects during this time span that are financed through debt financing.
Since peaking around 2018, Baidu’s D/E ratio has shown signs of moderation, indicating a possible shift toward a more balanced capital structure. This decline may reflect efforts to deleverage and improve financial stability, which could be appealing to long-term investors focused on risk management. Baidu’s D/E ratio has also shown some volatility, suggesting that while the company generally maintains a cautious approach to debt, there are periods where leverage increases—potentially due to large-scale investments in AI, cloud, and autonomous driving. This isn’t necessarily a red flag, as long as Baidu avoids becoming overly dependent on debt. Still, the combination of rising debt and inconsistent profitability should be monitored closely, as it could pose risks to financial flexibility if not managed prudently.
Price to earnings ratio (P/E)


Illustration 16 and 17: P/E ratio of Baidu from 2010 to 2024
For value investors, one of the most critical metrics when evaluating Baidu’s stock is the price-to-earnings (P/E) ratio, as it helps assess whether the company is undervalued or overvalued. Even if a company has strong financials, purchasing its stock at a high price can lead to poor returns. For example, imagine a business generating solid profits of $1 million per year. If the owner offers to sell you the business for just $1, it would be an incredible deal. But if the owner asks for $1 trillion, even though the business is profitable, the price would be absurdly overvalued. The stock market works similarly—companies can be priced cheaply on some days and excessively expensive on others.
Warren Buffett, a legendary value investor, typically considers stocks with a P/E ratio of 15 or lower as “bargains.” A high P/E ratio suggests that investors are paying a premium for the company’s earnings, expecting significant growth. The P/E ratio of Baidu has fluctuated widely, ranging from 79.6 in 2010, to 19.21 in 2019, spiking to 99.79 in 2020, and dropping significantly to 12.5 in 2025. These sharp fluctuations are a red flag for potential investors, as they indicate market uncertainty and inconsistent investor confidence in Baidu’s earnings potential. However, the current P/E ratio of 12.5 suggests that Baidu may be undervalued, especially when compared to its historical valuation levels. For value investors, this could represent a potential buying opportunity—provided that the company can stabilize earnings and deliver on future growth prospects.
Price to book value (P/B ratio)


Illustration 18 and 19: Price to book ratio of Baidu from 2010 to 2025.
Price-to-book value (P/B ratio) is a financial metric used to compare a company’s market value (its stock price) to its book value (the net asset value of the company, calculated as total assets minus total liabilities). The P/B ratio is calculated by dividing the current share price by the book value per share. A lower P/B ratio suggests that the stock may be undervalued, as investors are paying less for the company’s assets than their actual worth. Conversely, a high P/B ratiomay indicate that the stock is overvalued, or that investors expect high growth in the company’s future earnings. The P/B ratio is often used by value investors to assess whether a stock is trading at a fair price based on its underlying assets. Legendary Investor Warren Buffet prefers company’s with P/B lower than 1.5 and often buys around 1.3 or lower.
The price-to-book (P/B) ratio of Baidu is a green flag, as it is significantly lower than that of many competitors in the tech sector and falls below the levels Warren Buffett typically considers undervalued. This suggests that the company may be undervalued relative to its book value, meaning investors are paying less for its assets compared to peers. Furthermore, the overall downward trend in Baidu’s P/B ratio in recent years indicates weakening investor sentiment, even as revenues have continued to grow. This could reflect under-optimism about Baidu’s future growth or a disconnect between its stock price and its underlying fundamentals. If profitability continues to decline while the P/B ratio remains low, it could signal a risk of value traps—where a stock appears cheap but lacks the catalyst for recovery. Investors should carefully assess whether the company’s financial performance can support future growth or if the current low valuation reflects deeper structural concerns.
Dividend
As of 2025, Baidu does not pay a regular dividend to shareholders. Baidu has historically reinvested its earnings into research and development, artificial intelligence, autonomous driving, and other growth initiatives rather than returning capital to shareholders through dividends. This strategy is typical for many tech companies, especially those still focused on expansion and innovation. If you’re looking for dividend-paying Chinese tech companies, you might want to look at others like Tencent or Alibaba, which have initiated or considered dividend payments in recent years.
Insider Trading
Over the past few years, insider trading activity at Baidu has been relatively limited, which is generally a neutral to green flag for investors, as it suggests stability and confidence in the company’s long-term prospects. However, there have been some notable planned transactions. For instance, in October 2024, insider Melissa Dongmin Ma filed a Form 144 to sell approximately 395,000 shares valued at around $41.6 million, following a similar filing in July 2024 for 260,000 shares worth about $22.4 million. While such large proposed sales might raise eyebrows, they are not necessarily a red flag, especially if they are part of routine portfolio diversification or personal financial planning. The absence of widespread or frequent insider selling supports a cautiously positive view, but investors should still monitor any emerging trends that may reflect shifting internal sentiment.
Other Company Info
Founded in 2000, Baidu Inc. is a leading Chinese technology company specializing in internet-related services, artificial intelligence, and autonomous driving technologies. As of 2024, Baidu employs approximately 35,900 people, reflecting its continued investment in research and development across AI, cloud computing, and smart mobility. The company is publicly traded on the NASDAQ under the ticker symbol BIDU and operates within the Technology sector, specifically under the Interactive Media & Services industry.
Baidu is headquartered at No. 10 Shangdi 10th Street, Haidian District, Beijing, China. As of 2024, the company has approximately 348 million shares outstanding, with a market capitalization of around $45 billion USD. For more information, visit Baidu’s official website: https://www.baidu.com.


Illustration 20-22: Number of employees and location of Baidu Headquarters in Beijing China
Final Verdict
Investing in Baidu Inc. presents a compelling opportunity, particularly for investors seeking exposure to China’s AI and digital innovation sectors. As a pioneer in search engine technology and artificial intelligence, Baidu has positioned itself at the forefront of China’s tech evolution, with major investments in autonomous driving (Apollo), AI cloud services, and generative AI models. The company’s strong research capabilities and diversified revenue streams—from online marketing to cloud and AI solutions—underscore its long-term growth potential.
However, investors should approach with measured caution. Baidu’s earnings have shown significant volatility in recent years, and while its P/E ratio is currently low (around 12.5 as of April 2025)—suggesting undervaluation—this reflects muted investor sentiment amid regulatory uncertainty and inconsistent profitability. Additionally, Baidu does not currently pay a dividend, which may deter income-focused investors. Competition from domestic tech giants like Alibaba, Tencent, and ByteDance also remains a persistent challenge.
Overall, Baidu may be a suitable investment for long-term, growth-oriented investors who are comfortable with short-term volatility and regulatory risk in exchange for potential upside tied to China’s AI-driven future. However, Its Net Income should be monitored closely.