Tag: Investing

Nvidia Stock Analysis (January, 2025)

  1. Introduction to NVIDA as Company

NVIDIA Corporation, founded in 1993 by Jensen Huang, Chris Malachowsky, and Curtis Priem, has transformed the tech landscape with its relentless innovation. Headquartered in Santa Clara, California, the company is renowned for pioneering graphics processing units (GPUs) that power everything from video gaming to artificial intelligence (AI) and data centers.The efficiency of accelerated computing.

As of 2025, NVIDIA holds a commanding position in the semiconductor industry. The company’s stock (NVDA) has seen significant growth, driven by demand for GPUs in AI and gaming. Despite facing competition from AMD, Intel, and emerging players, NVIDIA has maintained its edge through innovation and strategic acquisition

Challenges persist, including supply chain disruptions and regulatory scrutiny, especially after the failed acquisition of ARM due to antitrust concerns. Nevertheless, NVIDIA continues to diversify its portfolio, ensuring long-term resilience.

A Legacy in Gaming

The company’s journey began with a groundbreaking achievement in gaming technology, introducing the GeForce 256 in 1999, the world’s first GPU. This innovation revolutionized gaming by delivering real-time 3D rendering and setting new standards for graphical fidelity. Over the years, NVIDIA’s GeForce GPUs have remained dominant in the gaming industry, constantly pushing the boundaries of performance and visual quality.

Technologies like ray tracing and DLSS (Deep Learning Super Sampling) have further enhanced gaming experiences, offering realistic lighting and shadows while optimizing performance.

NVIDIA has also contributed significantly to gaming hardware through innovations like G-SYNC, which ensures smooth gameplay by eliminating screen tearing. Additionally, the company has embraced the future of gaming with GeForce NOW, a cloud-based platform that enables high-end gaming experiences on a variety of devices.

Illustration 1: The Logo of NVIDIA, an eye symbolizing constant innovation.

The AI Revolution

While NVIDIA’s roots lie in gaming, its impact on artificial intelligence has been transformative. GPUs, initially designed for rendering images, have proven to be highly efficient for parallel processing tasks required in AI and machine learning. NVIDIA’s CUDA (Compute Unified Device Architecture) platform opened the door for researchers and developers to harness GPU power for tasks like neural network training.

The launch of the NVIDIA DGX systems and A100 Tensor Core GPUs has positioned the company as a leader in AI infrastructure. These technologies are integral to advancements in autonomous vehicles, robotics, natural language processing, and more. NVIDIA’s AI-driven technologies are used by companies across industries, from healthcare to finance, enabling breakthroughs in fields like drug discovery and fraud detection.


Data Centers and the Cloud

NVIDIA has expanded its reach beyond gaming and AI into data centers and cloud computing. The acquisition of Mellanox in 2020 strengthened NVIDIA’s position in networking and high-performance computing. NVIDIA’s GPUs are now at the heart of data centers worldwide, accelerating workloads for cloud providers, enterprises, and research institutions.

The company’s software platforms, including NVIDIA Omniverse and NVIDIA AI Enterprise, enable collaboration and innovation across industries. Omniverse, a 3D simulation and collaboration platform, is particularly promising in fields like virtual production, architecture, and design.

Automotive Innovation

NVIDIA is also a key player in the race toward autonomous vehicles. Its DRIVE platform offers end-to-end solutions for self-driving cars, providing everything from AI computing hardware to simulation tools. Partnerships with major automakers and startups demonstrate NVIDIA’s commitment to reshaping transportation with safer and more efficient systems.

Supercomputing

Nvidia is at the forefront of supercomputing. Its DGX systems combine the power of multiple high-performance GPUs to create supercomputers that drive some of the world’s most significant scientific discoveries. These systems are used in diverse areas like climate modeling, genomics, and physics simulations.

In addition, Nvidia’s acquisition of Mellanox Technologies in 2020 expanded its portfolio into high-speed networking, further enhancing its capabilities in supercomputing and AI. By providing end-to-end infrastructure solutions, Nvidia has positioned itself as a key player in the future of high-performance computing.

Illustration 2: A NVIDIA GPU (Graohic Processing Unit), one of the products NVIDIA is famous for.

2. Stock Analysis

In this section we will analyze NVIDIA stock to see if it is a good stock to buy or not. Our philosophy is value investing meaning that we try to find good quality companies that are undervalued. However, we will give a holistic overview so all kind of investors with different philosophies can judge the stock for themselves.

Revenue and Profits

To determine a company’s worth and if it is worth investing in, the company’s revenue and profits are a natural starting point to analyze. It should never bee forgotten that a stock represents a company just like the small companies in your home town. If the local barber asked if you wanted to by her hairsalone, your first question would naturally be how much does this barber shop make in profits and what is its debt. Furthermore, you want to research how it’s result have been over the years to make sure that the recent profits are not part of a downwards trend or just outliers.


Illustration 3 and 4: The revenue graph of NVIDIA from 2009 to 2024.

As illustrated in the graph above, NVIDIA’s gross revenue has shown a clear upward trend. With an earnings growth rate of 24.5%, the company is experiencing rapid expansion. While past performance does not guarantee future growth, most analysts anticipate continued revenue increases, particularly given NVIDIA’s involvement in high-growth sectors such as data centers, AI, and gaming. The revenue of NVIDIA is a clear positive sign and indicates that this is a company to be invested in since it’s revenue has continuely grown for the past years and there are no indications that this will slow down.

Illustration 5 and 6: The Net Income of NVIDIA from 2009 to 2024

Net income is a crucial metric to evaluate when determining whether a company is a worthwhile investment. It represents a company’s net profit or loss after accounting for all revenues, income items, and expenses, calculated as Net Income = Revenue – Expenses.

As illustrated in Figures 5 and 6, NVIDIA’s net income has shown a consistent upward trend, demonstrating steady growth. The company has been profitable since 2011 and has continuously increased its earnings, despite a few outliers in 2020 and 2023. Overall, NVIDIA’s net profit from 2009 to 2024 presents a strong case for potential investors, as it reflects a company that is both profitable and has exhibited sustained net income growth over the past 15 years.

Revenue Breakdown

Illustration 7: NVIDIA Revemue breakdown, gathered from and made by App Economy Insights at appeconomyinsights.com

As illustrated in illustration 7, NVIDIA has many different sources of revenue including from Data Centers, Gaming industry, professional visualization, automotive and OEM. However, the two largest revenue streams comes from Data Centers and gaming, especially data centers account alone for 47,5 % while gaming account for 10,4 %.

nderstanding this revenue distribution allows investors to assess NVIDIA’s resilience, growth potential, and exposure to key industries. With AI and cloud computing experiencing rapid expansion, NVIDIA’s strong presence in data centers positions it well for sustained long-term growth.

Dividend

For potential investors, it is important to note that NVIDIA’s dividend policy reflects a company that returns very little cash to shareholders. While this might typically be seen as a negative indicator for many companies, it does not necessarily signal a drawback in NVIDIA’s case.

Fast-growing companies often choose not to pay significant dividends, instead reinvesting their profits into expansion and innovation. NVIDIA follows this strategy, demonstrating confidence in its long-term growth potential. Rather than distributing earnings to shareholders, the company prioritizes strengthening its leadership in high-growth industries such as AI, gaming, and data centers.

This reinvestment strategy suggests that NVIDIA is committed to accelerating its competitive edge and maintaining its market dominance. The combination of minimal dividends and strong stock price appreciation makes NVIDIA particularly appealing to growth-oriented investors who prioritize long-term capital gains over immediate income. While income-focused investors may look elsewhere, those seeking exposure to a rapidly expanding technology leader may find NVIDIA an attractive addition to their portfolios.

Assets & Liabilities

Illustration 8 and 9: The total assets and liabilities of NVIDIA.

When evaluating a company as a potential investment, understanding its assets and liabilities is crucial. If a local barber offered to sell their shop, one of the first questions you would ask—after determining revenue and profit—would be about the business’s debt and the value of its assets. The same principle applies when assessing publicly traded companies like NVIDIA.

As shown in Illustrations 8 and 9, NVIDIA’s total assets have demonstrated a consistent upward trend, increasing from $3,351 million in 2009 to $65,728 million in 2024. A significant portion of these assets consists of cash on hand, which includes cash deposits at financial institutions and highly liquid short-term investments maturing within a year. This strong liquidity position means that NVIDIA is well-equipped to handle economic downturns or unforeseen crises, ensuring financial stability and the ability to seize new investment opportunities when needed.

As NVIDIA has grown, its total liabilities have also increased, which is a natural occurrence for expanding companies. However, a particularly notable feature in NVIDIA’s financials is the decline in long-term debt from 2022 to 2024. This reflects the company’s strong financial position, as it has been able to reduce its long-term obligations while continuing to grow.

The most important indicator when assessing a company’s financial health is Total Shareholder Equity, which is calculated as: Total Shareholder Equity=Total Assets−Total Liabilities.

This metric represents the company’s net worth, and if it is increasing, it signals that the company is becoming more valuable over time. As seen in Illustration 9, NVIDIA’s shareholder equity has grown from $2,395 million in 2009 to $42,978 million in 2024, a strong indication of financial strength and sustained growth.

Over the past 15 years, NVIDIA has built a solid financial foundation with steadily increasing assets, declining long-term debt, and strong shareholder equity growth. The company’s significant cash reserves further reinforce its ability to navigate potential economic challenges. With assets far exceeding liabilities, NVIDIA is in an exceptionally strong financial position, making it an attractive investment for those seeking stability and long-term growth.

Illustration 10: Earning per Share of NVIDIA from 2009 to 2024

Other key financial metrics also highlight NVIDIA’s strong financial health and positive development. One of the most important indicators of a company’s profitability is Earnings Per Share (EPS), which measures how much profit is allocated to each outstanding share of common stock. Investors and analysts use EPS to gauge a company’s financial performance and growth potential.

As illustrated in Figure 10, NVIDIA’s EPS has shown a clear upward trend from 2009 to 2015 and has remained consistently positive since 2011. This sustained growth in EPS signals that NVIDIA is generating increasing profits per share, reinforcing its strong financial position and solid profitability.

For investors, a rising EPS is generally considered a green flag, as it indicates that the company is successfully growing earnings while maintaining financial stability. NVIDIA’s positive EPS trajectory supports the case for its long-term growth potential, making it an attractive prospect for investors looking for profitable and well-managed companies.

Illustration 11 and 12 : Debt to equity ratio of NVIDIA from 2009 to 2024

The Debt-to-Equity (D/E) ratio is a key financial metric used to assess a company’s financial leverage and risk. It measures how much debt a company uses to finance its operations relative to shareholder equity. A high D/E ratio (greater than 1.0) suggests that the company relies heavily on debt financing, which can amplify financial risk, particularly during economic downturns when debt obligations may become more difficult to manage. In contrast, a low D/E ratio (below 1.0) indicates that the company is primarily financed through equity rather than debt, reducing financial risk but potentially limiting rapid expansion. A negative D/E ratio, on the other hand, signals that a company has more liabilities than equity—often considered a warning sign for investors.

Legendary value investors like Warren Buffett favor companies with a D/E ratio below 0.5, meaning they have at least twice as much equity as debt. Buffett avoids companies with excessive debt since high interest payments can erode profits, particularly in periods of economic instability. Additionally, he prioritizes businesses that maintain a stable or declining D/E ratio over time rather than those that take on large amounts of debt unexpectedly.

As illustrated in Figures 11 and 12, NVIDIA’s D/E ratio has remained consistently low and has now fallen below 0.5—a remarkable achievement for a high-growth company. Typically, growth-oriented firms rely on significant debt to finance rapid expansion, but NVIDIA has managed to grow without overleveraging itself. Furthermore, the company has never recorded a negative D/E ratio, reinforcing its financial stability and making it an attractive option for risk-conscious investors.

Price to earnings ratio

Illustration 12 and 13: The P/E ratio of NVIDIA

For value investors, the most important metric when evaluating a stock is the price-to-earnings (P/E) ratio, which helps determine whether a company is undervalued or overvalued. Even if a company has outstanding financials, buying its stock at an excessively high price can lead to poor returns. To illustrate this, imagine a local barber shop that generates solid profits. If the owner offers to sell you the business for $1, it would be an incredible deal. However, if he tries to sell it for $1 billion, no matter how successful the shop is, the price would be absurdly overvalued. The stock market operates in a similar way—companies can be cheaply priced on some days and highly expensive on others.

Currently, NVIDIA has a P/E ratio of 52.24, which is considered very high. To put this into perspective, legendary value investor Warren Buffett typically considers stocks with a P/E ratio of 15 or lower to be “bargains.” A high P/E ratio suggests that investors are paying a premium for the company’s earnings, potentially expecting significant growth. However, it also means that the stock is far more expensive compared to its earnings, which can be a red flag for value investors. The elevated P/E ratio of 52.24 indicates that NVIDIA is trading at a premium and may be overpriced based on traditional valuation metrics. This could pose a risk for investors, as the stock might struggle to sustain such high expectations. If NVIDIA fails to deliver on its projected growth, the stock price could face significant downward pressure.

While NVIDIA is a strong and innovative company, value investors may hesitate to buy at these valuation levels. Buying stocks at the right price is just as important as picking the right companies. At a P/E ratio this high, NVIDIA may not fit within a classic value investor’s strategy and could be considered overvalued in the current market.

Insider Trading

A crucial metric to consider when evaluating whether a company is worth investing in is insider trading activity—specifically, whether company insiders have been buying or selling shares over the past year. It’s particularly important to assess who has been trading, as directors should be monitored even more closely than officers.

As shown below, there has been significant insider selling, which is a major red flag. Notably, this selling includes transactions from directors and even the CEO, raising serious concerns. Such activity could indicate that insiders anticipate weaker financial performance, expect the stock price to decline, or believe the stock is overvalued—a concern that aligns with the valuation analysis above.

If those inside the company lack confidence in its future, why should outside investors? See Illustration 14 below for a detailed record of the latest insider transactions.

InsiderTransactionTypeValueDate
PURI AJAY KOfficerSale at price 150.40 – 152.50 per share.Indirect5,544,783Jan 7, 2025
STEVENS MARK ADirectorStock Gift at price 0.00 per share.Indirect0Dec 18, 2024
COXE TENCH CDirectorStock Gift at price 0.00 per share.Indirect0Dec 17, 2024
COXE TENCH CDirectorSale at price 131.03 – 132.64 per share.Indirect131,263,863Dec 16, 2024
ROBERTSON DONALD F JROfficerSale at price 133.34 – 138.78 per share.Direct608,775Dec 13, 2024
KRESS COLETTE M.Chief Financial OfficerSale at price 133.24 – 138.88 per share.Direct9,027,318Dec 13, 2024
OCHOA ELLENDirectorStock Award(Grant) at price 0.00 per share.Direct0Dec 9, 2024
DABIRI JOHN ODirectorSale at price 142.00 per share.Direct101,672Nov 25, 2024
STEVENS MARK ADirectorSale at price 132.27 per share.Indirect20,502,578Oct 9, 2024
TETER TIMOTHY SGeneral CounselStock Gift at price 0.00 per share.Direct0Oct 3, 2024
STEVENS MARK ADirectorSale at price 122.61 per share.Indirect15,325,950Oct 3, 2024
STEVENS MARK ADirectorSale at price 121.01 per share.Indirect4,840,356Sep 27, 2024
STEVENS MARK ADirectorSale at price 121.27 per share.Indirect20,021,429Sep 24, 2024
HUANG JEN-HSUNChief Executive OfficerStock Gift at price 0.00 per share.Indirect0Sep 20, 2024
COXE TENCH CDirectorSale at price 116.27 – 119.27 per share.Indirect235,741,095Sep 20, 2024
ROBERTSON DONALD F JROfficerSale at price 116.18 – 118.15 per share.Direct524,293Sep 20, 2024
KRESS COLETTE M.Chief Financial OfficerSale at price 116.19 – 118.05 per share.Direct7,772,851Sep 20, 2024
HUANG JEN-HSUNChief Executive OfficerSale at price 115.82 – 120.29 per share.Direct28,551,919Sep 13, 2024
HUANG JEN-HSUNChief Executive OfficerSale at price 104.99 – 117.07 per share.Direct26,252,485Sep 11, 2024
HUANG JEN-HSUNChief Executive OfficerSale at price 100.99 – 108.00 per share.Direct25,044,854Sep 9, 2024
HUANG JEN-HSUNChief Executive OfficerSale at price 104.62 – 109.30 per share.Direct25,805,490Sep 5, 2024
HUANG JEN-HSUNChief Executive OfficerSale at price 107.81 – 121.29 per share.Direct27,574,820Sep 3, 2024
HUANG JEN-HSUNChief Executive OfficerSale at price 97.80 – 106.29 per share.Direct24,915,914Aug 9, 2024
HUANG JEN-HSUNChief Executive OfficerSale at price 98.84 – 108.19 per share.Direct25,069,567Aug 7, 2024
HUANG JEN-HSUNChief Executive OfficerSale at price 91.72 – 108.23 per share.Direct24,609,476Aug 5, 2024
HUANG JEN-HSUNChief Executive OfficerSale at price 106.94 – 120.05 per share.Direct27,426,748Aug 1, 2024
HUANG JEN-HSUNChief Executive OfficerSale at price 102.85 – 116.11 per share.Direct26,383,025Jul 30, 2024
HUANG JEN-HSUNChief Executive OfficerSale at price 106.79 – 116.22 per share.Direct27,216,126Jul 26, 2024
HUANG JEN-HSUNChief Executive OfficerSale at price 113.85 – 124.20 per share.Direct28,869,762Jul 24, 2024
HUANG JEN-HSUNChief Executive OfficerSale at price 117.86 – 124.02 per share.Direct28,954,933Jul 22, 2024
HUANG JEN-HSUNChief Executive OfficerSale at price 116.83 – 122.12 per share.Direct28,679,816Jul 18, 2024
HUANG JEN-HSUNChief Executive OfficerSale at price 124.84 – 131.17 per share.Direct30,638,085Jul 16, 2024
HUANG JEN-HSUNChief Executive OfficerSale at price 127.70 – 136.00 per share.Direct31,266,275Jul 12, 2024
PURI AJAY KOfficerSale at price 127.76 – 131.40 per share.Indirect13,023,949Jul 12, 2024
STEVENS MARK ADirectorSale at price 129.81 per share.Indirect20,254,063Jul 12, 2024
HUANG JEN-HSUNChief Executive OfficerSale at price 128.88 – 135.07 per share.Direct31,864,601Jul 10, 2024
STEVENS MARK ADirectorSale at price 130.65 – 134.16 per share.Indirect103,998,016Jul 10, 2024
HUANG JEN-HSUNChief Executive OfficerSale at price 125.91 – 130.33 per share.Direct30,688,598Jul 8, 2024
HUANG JEN-HSUNChief Executive OfficerSale at price 121.67 – 128.08 per share.Direct29,581,600Jul 3, 2024
TETER TIMOTHY SGeneral CounselStock Gift at price 0.00 per share.Direct0Jul 1, 2024
HUANG JEN-HSUNChief Executive OfficerSale at price 118.94 – 127.19 per share.Direct29,738,301Jul 1, 2024
DRELL PERSIS SDirectorStock Award(Grant) at price 0.00 per share.Direct0Jun 27, 2024
SHAH AARTI SDirectorStock Award(Grant) at price 0.00 per share.Direct0Jun 27, 2024
NEAL STEPHEN C.DirectorStock Award(Grant) at price 0.00 per share.Direct0Jun 27, 2024
DABIRI JOHN ODirectorStock Award(Grant) at price 0.00 per share.Direct0Jun 27, 2024
JONES HARVEY C JR.DirectorStock Award(Grant) at price 0.00 per share.Direct0Jun 27, 2024
STEVENS MARK ADirectorStock Award(Grant) at price 0.00 per share.Direct0Jun 27, 2024
BURGESS ROBERT KENNETHDirectorStock Award(Grant) at price 0.00 per share.Direct0Jun 27, 2024
HUDSON BEACH DAWN EDirectorStock Award(Grant) at price 0.00 per share.Direct0Jun 27, 2024
LORA MELISSADirectorStock Award(Grant) at price 0.00 per share.Direct0Jun 27, 2024

Illustration 14: Full list of all newest insider trades by NVIDIA officials.

Other Company Info

As illustrated below, NVIDIA currently have 29,6 thousands employees which showcases the company’s huge growth as it only had 8,8 thousands employees in 2014. The company itself was founded in 1993, it has the ticker NVDA and is listed on the NasdaqGS exchange. Its industry is officially semiconductors and it has 24.49 billion shares outstanding.

NVIDIA’s headquarters are at 2788 San Tomas Expressway, Santa Clara, California, 95051, United States of America as can be seen below-

Illustration 15-17: Number of employees at NVIDIA and its location.

Final Verdict

In conclusion, NVIDIA is a solid company with impressive growth potential, operating in high-demand sectors such as data centers, AI, and automation, all of which are poised for substantial expansion in the coming years. The company has consistently demonstrated its ability to grow, backed by a strong historical earnings record. Its financials are robust, with ample assets and cash reserves, and its shareholder equity remains positively strong. Additionally, its EPS is healthy, reflecting solid profitability.

That said, for value investors, I would caution against purchasing NVIDIA stock at this time. The stock appears overvalued based on current market conditions. Moreover, there is a significant amount of insider selling, which raises concerns. This selling could indicate that insiders believe the stock is overpriced and are capitalizing on the opportunity, or it could suggest underlying factors that are not yet publicly known but might signal potential risks ahead.


How to Find Reliable Manufacturers for Your Business

Starting a business is a very exciting adventure. However, it comes with its share of challenges, particularly in the early stages. ne of the most crucial aspects of building and sustaining a successful business is maintaining a consistent supply of high-quality goods or services. Reliable supply chains are the lifeblood of any business and play a vital role in avoiding financial pitfalls and bankruptcy. For new entrepreneurs, identifying the right suppliers can feel overwhelming. This article is meant to serve as a step-by-step guide to help you discover, evaluate, and build strong partnerships with dependable suppliers and manufacturers.

Image 1: A manufacturer producing microchips, highlighting the complexities of manufacturing products.

Once an entrepreneur has decided on a product to sell—such as for example watches—they must determine how to source that product. One option is to produce it themselves. However, as products become increasingly complex, and since most people lack the expertise or resources to manufacture everything on their own, entrepreneurs often need to find a cost-effective source for their goods. This is where manufacturers play a crucial role.

A manufacturer is a company that converts raw materials into finished products. These products are then sold to consumers, wholesalers, distributors, retailers, or even other manufacturers to create more complex items. Many manufacturers focus on a specific type of product to improve efficiency and reduce costs. For example, you might collaborate with:

  • A toy manufacturer for creating toys;
  • A electronics manufacturer for creating cameras;
  • A food manufacturer for making cookies;
  • etc.

    Working with multiple suppliers and manufacturers

    A key piece of advice for businesses is not to limit yourself to working with just one manufacturer. Partnering with multiple manufacturers can help you diversify your inventory, create a unique product mix, and establish a safety net in case of delays or contract issues. This strategy, known as supplier diversity, is an effective way to mitigate supply chain risks.

    A smart approach is to secure two manufacturers: one domestic and one international. The domestic manufacturer can act as a backup, ensuring stock availability and customer satisfaction if issues arise with international orders, such as delays or errors. While domestic suppliers may be more expensive, they offer reliability and quick response times, which can be invaluable during disruptions in your foreign supply chain.

    Image 2: A manufacturer specialized in creating watches.

    How to find a manufacturer

    Now, you’re probably wondering how to find the right manufacturer. Ideally, you want a partner who can deliver high-quality products at a low cost, with minimal shipping times, and with whom you can establish a strong business relationship. Poor-quality or overpriced products can jeopardize your business, potentially leading to financial failure. Similarly, strained relationships with manufacturers can cause significant headaches and, in the worst cases, legal disputes.

    This article will now guide you step by step through the entire process of finding the perfect manufacturer for your business needs.


    Step 1- Identify all potential suppliers

    The first step is to identify and map out all potential manufacturers. To make an informed decision about which manufacturer to choose, you must first research and determine which manufacturers are available and suitable for your needs. Here are the most essential tools to assist you in your search:

    Google: Begin with a straightforward Google search for “manufacturers near me” to identify local options. Examine their websites, customer feedback, and areas of expertise to evaluate their fit for your requirements. You can also search for manufacturers in google maps to see which ones are closest to you.

    Image 3: Google maps can be a business owner’s most essential tool.

    Helpful tip: Supplier websites are often outdated or lacking in detailed information. Use a variety of search terms, such as ‘wholesale,’ ‘supplier,’ and ‘distributor,’ to expand your search. Additionally, take advantage of Google’s advanced search features to refine and improve your results.

    Referrals: One of the most important ways to find potential suppliers is through your network. Don’t hesitate to:

    • Seek supplier recommendations from your professional network;
    • Connect with successful entrepreneurs in your industry for guidance, and
    • Participate in Facebook groups and online e-commerce communities to gather reviews and suggestions.

    Suppliers who aren’t a perfect fit may still guide you to the right connections. Industry experts often have access to a network of trusted contacts, so be sure to ask for recommendations when reaching out.

    NAICS codes: The North American Industry Classification System (NAICS) assigns specific codes to manufacturers and products, making it easier to find suppliers, particularly in professional directories. Refer to the NAICS codes for the United States and Canada to simplify your search.

    Once you’ve shortlisted your options, it’s crucial to conduct a thorough background check on potential manufacturers. Review the Better Business Bureau (BBB) for any complaints and explore customer feedback to confirm their reputation and reliability

    Alibaba: Alibaba is a well-known platform that connects you with manufacturers, mainly from China. You can use it to discover existing products or find manufacturers for custom creations. Alibaba is the place most businesses find their manufacturer. You can search for your product there and find potential suppliers. You can filter potential manufacturer by country, price, etc.

    Image 4: Alibaba is a great way to connect with suppliers.

    When researching manufacturers on Alibaba, look for these qualifications:

    • Gold supplier status (they pay for Alibaba membership)
    • Verified status (a third-party evaluation services company or Alibaba has visited their facility)

    Trade shows bring businesses together to showcase their latest products and services, often taking place over several days in convention centers across major cities. In addition to large-scale events, there are also smaller, regional trade shows that highlight local businesses. These events offer valuable opportunities to experience products in person, connect with business owners, and discover fresh ideas and trends that could inspire new product developments


    Trade assurance (free service protecting your orders from payment to delivery) 

    When looking for manufacturers, consider using filters to identify those with certifications like SA8000, which ensures humane working conditions, if this aligns with your business values. It’s essential to confirm you’re engaging directly with manufacturers, not intermediaries or trading companies, as this can lead to higher costs. Opting for a manufacturer with a track record of at least five years can also help mitigate the risk of financial instability and ensure a more reliable partnership.

    Figure 5: Searching manufacturing directories can be a good way to find manufacturers.

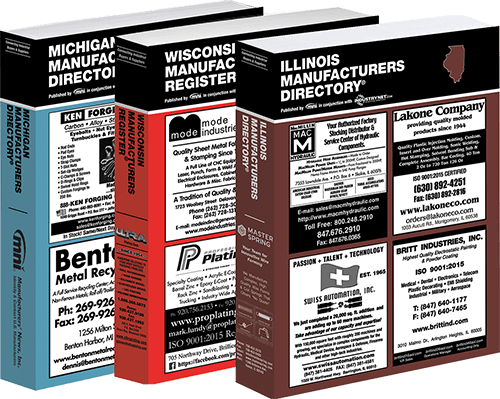
    Manufacturing directories: Online supplier directories are another valuable resource. These catalogs offer the profiles of thousands of manufacturers, wholesalers, and suppliers. Here are some popular options:

    Online domestic (USA) directories:

    Online overseas directories:

    Overseas manufacturing, particularly in countries like India, China, and Vietnam, often offers lower costs. According to U.S. News & World Report, these three countries ranked as having the cheapest overseas manufacturing costs. However, consider factors beyond just price when making your decision.

    Step 2 – Research your potential manufacturers

    Once you’ve identified potential manufacturers, it’s time to request quotes. Aim for at least three quotes to effectively compare your options. For local manufacturers, consider scheduling a tour of their facilities or visiting their office to observe their operations firsthand. This will give you insight into product quality and overall processes. Additionally, explore other manufacturers in the same country that may not be listed online.

    Figure 6: It is a pro-tip to travel to to and visit the manufacturer.

    Even if the manufacturer is located in another country, such as in Asia, it can still be extremely valuable to visit their operations in person. Traveling to see the facility firsthand allows you to assess product quality, understand the processes, and build relationships with the factory leadership. The leaders of several of the largest fortune 500 companies started off by visiting a factory to find the right products.

    An example of this can be Nike founder Phill Knight that started his business by traveling to Japan in his quest for finding the perfect shoe manufacturer.

    Beyond pricing, here are key questions to ask:

    1. Can they handle custom orders? Assess whether they have the skills, resources, and automation features to create your specific product.
    2. What are their lead times? Ensure they can deliver products quickly enough to keep your customers happy and your inventory stocked.
    3. What are the shipping costs? Shipping is a significant expense for small businesses.
    4. What are their minimum order quantities (MOQs)? While it’s best not to lead with this question, you’ll need to know the minimum number of items required for production. Remember, this is often negotiable!! Do not get intimidated if they have a high number of MOQs on their website.
    5. What’s the cost per unit? Negotiate this alongside MOQs. Generally, larger orders can lead to lower per-unit costs. 
    6. Can they offer exclusivity? If you’re investing in tooling, ensure they won’t allow others to use it. You might also explore territorial, market, or total exclusivity options, or even private label goods.
    7. Are there setup fees? Some manufacturers charge fees to prepare equipment for your production run. 
    8. What’s their defect policy? Clarify who covers the cost for incorrect or defective items, including shipping and duties.
    9. Is the manufacturer sustainable and ethical? Inquire about factory conditions and their impact on workers and the environment.

    Compare prices: Even if you’ve found a supplier with high-quality products and a strong reputation, it’s important to ensure their prices remain competitive. For startups with limited business experience, comparing prices from different suppliers can help you gauge the average cost of the materials you need. It’s wise to continue this practice even after selecting a supplier to ensure you consistently get the best prices for your products.


    Even if you already have a supplier, it’s still smart to regularly compare your supplier’s prices to the prices of their competitors. By doing this, you’ll ensure that you’re always paying the minimum you need to for your supplies, which is an excellent way to cut costs in a small busines

    Tips to negotiating effectively is to:

    1. Understand the reason behind the supplier’s minimum. Is it due to upfront work? Do they prefer larger buyers?
    2. Use this understanding to propose a compelling counter-offer.
    3. If a foreign manufacturer: learn about the culture and business traditions in the country before you send them a message/e-mail it will make them respond more positivly.

    Many suppliers ask new businesses to pay for full orders upfront, which is important to consider, as inventory costs can be significant for e-commerce businesses. Be sure to inquire about payment terms for future orders as well. However, many reputable manufacturers are open to negotiating these terms. One option is to propose a 50/50 payment split: 50% upfront and 50% upon receiving the shipment. This approach helps balance the risk for both parties.

    Figure 7: Communication and negotiation with the manufacturer is an unavoidable part of the process and therefore essential

    Suppliers often receive many quote requests, which can result in delayed responses or even ignored emails. If you’re uncertain about your request, consider making a quick phone call or sending a brief email with a single question to clarify before submitting a full inquiry.

    When launching your online business, you’ll probably manage communication with manufacturers yourself, using phone, email, or text. For local manufacturers, in-person meetings are also an option. Choose trading companies that are responsive and proactive in working with you. If a potential partner is slow to reply or reluctant to send samples, they might not be the right fit for your business.

    Your initial email should be clear and concise, focusing on assessing the potential fit with the supplier. Highlight key details that matter most to suppliers, such as sourcing information.

    While it’s important to inquire about pricing for various quantities, avoid bombarding them with too many questions. Keep the message focused on essential information.

    Step 3 – Customize and design your product

    After your initial discussions with potential manufacturers, it’s time to share your product design. While some manufacturers offer product development services, including prototyping and 3D modeling, these can be expensive. Consider alternative ways to communicate your ideas, such as: 

    • Sketches
    • Written instructions
    • Reference photos 

    Figure 8: Creating a customized design is essential.

    If your chosen manufacturer doesn’t offer design services, you can turn to freelancers on platforms like Fiverr or Upwork for professional design work. Consider hiring:

    • Industrial designers
    • Product designers
    • CAD (computer-aided design) specialists
    • Consider working with a local designer for prototypes and custom molds, which may be more cost-effective than using a manufacturer.

    Private label products involve manufacturers creating a customized version of an existing product just for your business. Depending on the manufacturer and product, you can request unique branding, materials, ingredients, and features to make your product stand out. Customers often favor private labels, and adding your logo is a powerful way to build your brand identity.

    Step 4 – Request samples from suppliers and assess their quality.

    A business’s reputation depends on the quality of its products. Poor-quality goods from suppliers can harm your reputation when sold. To avoid this, always request a sample before making a large purchase and moving into full production. Once satisfied, date and sign the sample, and keep one or two as control references.

    Control samples act as a quality assurance tool to ensure product consistency. For instance, if a shipment arrives with incorrect colors, you can use the control sample to highlight the discrepancy

    A sample is typically a single unit of the desired product, allowing you to test its quality. While some suppliers offer free samples, others may require payment.

    If a supplier refuses to provide samples, even for a fee, consider working with them on a trial basis. However, proceed with caution and keep a few key considerations in mind.

    Start small when testing a new supplier. Instead of filling your entire inventory, purchase a limited quantity—such as a week’s worth of materials rather than a month’s supply. This way, if the supplier doesn’t meet your expectations, you won’t be left with a large stock of low-quality products.

    Only consider using a supplier on a trial basis if they appear trustworthy and reliable in other aspects. If their prices are competitive and they have a strong reputation, it’s likely safe to proceed without a sample. However, if you can’t obtain samples and have little information about the supplier, testing them could lead to more issues than benefits..

    Step 5 – Place your order

    Even after receiving samples, there’s still room to negotiate terms on payment or MOQ. When negotiating: Focus on building a long-term, healthy supplier relationship and consider the manufacturer’s perspective.

    Remember, the goal isn’t to exploit your manufacturing partner for the lowest price, but to create a mutually beneficial partnership.Remember, the goal isn’t to exploit your manufacturing partner for the lowest price, but to create a mutually beneficial partnership.

    Make sure to hold a high standard and be professional in your contact with the manufacturer as to not seem as an unserious business.


    When everything is done, dont forget to place your order.

    Important factors to keep in Mind

    The impact of quality on pricing

    Premium materials, like switching from cotton to cashmere in apparel production, typically come with higher costs. While these materials can enhance a product’s perceived value, they require a larger upfront investment, leading to a longer wait to recover costs through sales.

    Figure 9: Silk which is a high-quality product.

    Balancing cost savings with product durability

    Non-durable products may affect customer satisfaction but can drive repeat business. Durable products, while commanding higher prices, last longer but are more costly to source. Market research can help you understand the importance of durability to your target audience. For example budget-conscious customers may prefer a $5 umbrella that lasts one season while high-income clients may invest in premium, long-lasting items

    Identifying hidden costs in manufacturing

    The initial quote from your supplier is just a starting point. Be aware of possible extra costs, particularly when working with overseas manufacturers or wholesale suppliers, including:

    International shipping, including customs duties and tariffs, currency exchange rates, third-party quality control or inspection checks, rework and defect costs if the original sample isn’t up to standard and expenses for custom molds or machines 

    Future trends in manufacturing 

    Personalized production

    Mass customization tailors products to individual preferences at scale, unlike mass production. McKinsey research shows companies excelling in personalization generate 40% more revenue than average, a trend also seen in manufacturing.

    Manufacturers can fulfill complex customer orders using technologies like 3D printing, robotics, and data analytics. This allows for flexibility and agility in production without excessive costs. As consumer demand for personalized products grows, manufacturers who adapt will gain a competitive advantage.

    Increased use of biomanufacturing

    Biomanufacturing, also known as bioprocessing or biotechnology manufacturing, utilizes biological systems like cells or microorganisms to produce products such as pharmaceuticals, biofuels, food, and cosmetics.

    The main benefit of biomanufacturing is its sustainability. Biomanufacturing is sustainable, using renewable resources instead of fossil fuels and generating fewer emissions. It also enables the production of complex molecules and materials that traditional methods can’t synthesize.

    This manufacturing method will be especially important in fast-paced industries with fluctuating demand or evolving product needs. The biomanufacturing market is already growing, expected to reach over $85 billion, up from $18 billion in 2020.

    Figure 10: A company using biomanufacturing as an alternative way to produce products.


    Servitization

    Servitization enables manufacturers to boost revenue by offering services alongside traditional manufacturing. These can include aftermarket goods, maintenance services, training, and customer support agreements.

    By embracing servitization, manufacturers can foster stronger, more profitable customer relationships and create new recurring revenue streams. This trend is especially relevant in industries with long product life cycles, like machinery, equipment, and vehicles

    Smart Factories

    A recent Deloitte survey highlights smart factories as a key priority for manufacturers in 2024. Amid rising costs and economic uncertainty, 83% of manufacturers believe smart factory solutions will transform production in the next five years. These factories use IoT, AI, and machine learning to optimize processes, reduce downtime, and improve efficiency. As competition grows, smart factories are likely to become the industry standard.

    Figure 11: The use of AI for manufacturing is a trend that will continue.

    Social Media

    Mastering social media has become essential for businesses, as it offers a powerful tool for reaching and engaging with potential customers. Online influencers, using platforms beyond just LinkedIn and blogs, can recommend specific vendors to their audience, driving traffic and sales. This is often done through links to eCommerce websites or stores on platforms like Shopify.

    Influencers can be compensated in two main ways: they may receive upfront payment as partners of the sponsoring vendor or earn commissions as affiliates for each purchase made through their referral links. This strategy allows businesses to tap into the influencer’s network, boosting visibility and sales, especially in a digital-first world.

    The South Korean Economy: A Story of Remarkable Transformation and Resilience

    South Korea, officially known as the Republic of Korea (ROK), presents an intriguing case study in economic development. From the ravages of the Korean War to becoming an economic powerhouse, the South Korean economy’s journey is a testament to a combination of strategic planning, relentless hard work, and innovative spirit.

    From its humble beginning the countries economy had grown to a nominal GDP of ₩2.24 quadrillion (US$1.72 trillion) making it the 4th largest economy in Asia and the 12th largest in the world

    Part of the OECD and the G20. South Korea’s education system and an educated and motivated population was largely responsible for the technology boom and economic development in the country. South Korea adapted an export-oriented economic strategy to fuel its economy. In 2019, South Korea was the eight largest exporter and eight largest importer in the world.

    Financial organizations, such as the international monetary fund comments that the South Korean economy is resilient against various economic crises. They country’s economic advantages such as its low state debt, and high fiscal reserves and its country’s major economic output being the technology products exports is the reason behind this resilience.

    However, despite the South Korean economy’s high growth and structural stability, the credit rating of the country is damaged in the stock market due to North Korea in times of military crisis. The recurring conflict affects the financial markets of its economy

    The Beginning

    The foundation of the South Korean economic story is deeply rooted in its tumultuous history. After gaining independence from Japan in 1945, Korea was split into North and South. The Korean War (1950-1953) devastated the South Korean economy, leaving it as one of the poorest countries in the world.

    However, South Korea only remained a country with less developed markets for a little more than a decade after the Korean war.


    The principal reason behind the growth of the South Korea’s economic development is the industrial sector. Due to strong domestic encouragement and some foreign aid, Seoul’s industrialists introduced modern technologies into outmoded or newly built facilities, increased the production of commodities especially those for sale in foreign markets and invested the proceeds back into further industrial expansion. As a result, industry altered South Korea’s landscape, drawing millions of labourers to urban manufacturing centres.

    The Miracle on the Han River

    In the beginning in the 1960s, under the leadership of Park Chung-hee, South Korea underwent rapid industrialization and modernization, an era often referred to as the “Miracle on the Han River.”

    The government instituted comprehensive reforms and laid the groundwork for an export-driven economy. To promote development, a policy of export oriented industrialization was applied, closing the entry into the country of all kinds of foreign products, except raw materials. Major industries, such as steel, shipbuilding, and chemicals, were heavily promoted. Infrastructure, education, and R&D became vital investment areas.

    The 1970s and 1980s saw the rise of family-controlled conglomerates, or “chaebols,” like Samsung, Hyundai, and LG. Their growth was often backed by government policies, and they became significant players in driving South Korea’s economic expansion.

    Through the model of export-led industrialization, the government incentigvized corporations to develop new technology and upgrade productive efficiency to compete the global market. By adhering to state regulations and demands, firms were awarded subsidization and investment support to develop their export markets in the evolving international arena. The chaebols received state incentives such as tax breaks, legality for their exploitation system and cheap or free financing In addition, the inflow of foreign capital was encouraged to supplement the shortage of domestic savings. These efforts enabled South Korea to achieve growth in exports and subsequent increases in income.

    By emphasizing the industrial sector, Seoul’s export-oriented development strategy left the rural sector barely touched. The steel and shipbuilding industries in particular played key roles in developing South Korea’s economy during this time.

    The Asian financial crisis and its aftermath


    In 1997, South Korea, along with many Asian nations, faced a severe financial crisis. The chaebols’ excessive borrowing and a fixed exchange rate regime were among the primary reasons for South Korea’s vulnerability. The crisis led to significant economic restructuring, with the International Monetary Fund (IMF) providing a $58 billion bailout package.

    Hosting the 1988 Summer Olympic Games, commonly known as Seoul 1988, provided the country with the momentum to join the ranks of semi-advanced countries. The overseas mass media called South Korea one of the four Asian tigers along with Taiwan, Singapore, and Hong Kong. In December 1996, the country became the 29th member country of the OECD, which is largely composed of advanced countries.

    In response, the South Korean government implemented stringent reforms, including financial sector liberalization, corporate governance reforms, and the restructuring of chaebols. By 2001, the country had remarkably bounced back, with its economy growing at 4%.

    High-tech industries in the 1990s and 2000s

    In 1990, South Korean manufacturers planned a shift in future production toward high-technology industries. In June 1989, panels of government officials, scholars, and business leaders held planning sessions on the production of such goods as new materials, mechatronics, bioengineering, microelectronics, fine chemistry, and aerospace.

    This shift did not mean an immediate decline in heavy industries such as automobile and ship production, which had dominated the economy in the 1980s.

    In November 1997, a foreign exchange crisis hit the country, forcing it to turn to the IMF for a bailout. It was the first ordeal the country had to confront after years of rapid economic growth. The country took the drastic step to drive insolvent businesses out of the market and then pushed ahead with industrial restructuring. In only two years, the country regained its previous growth rate and price levels as well as a current account balance surplus. In the process, some 3.5 million people joined in the campaign to collect gold to help the government repay the fund borrowed from the IMF. A total of 227 tons of gold were collected. The world marveled at the South Koran people’s voluntary participation in the determined effort to repay its national debts

    South Korea today is known as a Launchpad of a mature mobile market, where developers thrive in a market where few technology constraints exist. There is a growing trend of inventions of new types of media or apps, using the 4G and 5G internet infrastructure in South Korea. South Korea has today the infrastructures to meet a density of population and culture that has the capability to create strong local particularity. The country has displayed global competitiveness in various fields such as mobile phones, semiconductors, automobiles, chemicals, and steelmaking. In recent years, its cultural content, including music, gaming, and webtoons, is emerging as an essential industry in itself, taking the lead in the Korean economy.


    The chaebols are large family-owned business conglomerates that dominate South Korea’s economic, political, and social life. Their roots trace back to the 1960s and 70s when South Korea, under the leadership of then-president Park Chung-hee, embarked on an ambitious plan of industrialization. The government formed strategic partnerships with select business groups, offering them financial incentives, cheap loans, and protection from competition in exchange for their commitment to the national industrialization effort.

    At the heart of every chaebol is a founding family. The typical culture at one of these conglomerates is highly paternalistic. Much of the environment is defined by the chairman who acts as a “fatherly figure” to his subordinates. Workers commit to long hours, most notably on weekends and holidays, to appease their superiors. Company outings and drinking sessions tend to be compulsory to foster a sense of family and belonging among employees. Employers believe that enhancing a common bond between them would translate into prosperity and productivity for the company. Other practices that would be uncommon for Western workplaces to engage in include gift-giving to employees and arranging dates for workers in search of relationships or marriage.

    Chaebols are notoriously hierarchical. As such, it is unusual for an individual to challenge or question the decision-making of his or her boss. Promotion is rarely merit-based. Rather, it is through the order of age and time served to the conglomerate. If a worker does not attain an executive or senior-management role by the age of fifty, he or she is commonly forced to resign.

    Because of South Korea’s long-lasting relationship with chaebols, South Korea has always suppressed and ignored labour unions. As of 2019, there are only two legally recognized labour unions in South Korea: The Federation of Korean Trade Unions and the Korean Confederation of Trade Unions. Despite these unions’ attempts at reform, the South Korean government does not take many actions. If a union oversteps and openly criticizes a chaebol, it faces serious repercussions, as chaebols are essentially government entities. It is well known that chaebols evade taxes regularly.  

    Many South Korean family-run chaebols have been criticized for low dividend payouts and other governance practices that favor controlling shareholders at the expense of ordinary investors. Because of their major role in the Korean stock market, foreign investors play a massive part in whether or not chaebol conglomerates remain financially successful.

    Foreign investors tend to avoid chaebols, especially those that displayed heavy political influence in South Korea, like Samsung and Hyundai. Investors are reluctant to invest in large control-ownership disparity businesses because these companies tended to cheat shareholders to have higher personal financial gain. A study published in the Journal of the Japanese and International Economies found that after the 1997 Asian financial crisis, foreign investment behavioural patterns changed drastically. While foreign investors like to hold shares in large companies with high profit and liquidity margins, they do not show any particular interest in either chaebol or non-chaebol companies. Nonetheless, chaebols are still able to survive, highlighting just how much power and aid they receive from the Korean government. All but 3 of the top 50 firms listed on the Korean Stock Exchange are designated as chaebols, and despite chaebols only accounting for just over 10 percent of the country’s workers, the four largest chaebols hold 70 percent of total market capitalization, and all chaebols together holding 77 percent as of the late 2010s.

    Even though they might hold a minor stake in terms of shares, they exercise considerable control through a complex web of cross-shareholdings among subsidiary companies. One of the characteristics of a Chaebols is diversification meaning have a diverse range of businesses. For instance, Samsung, initially a trading company, has expanded into electronics, shipbuilding, construction, insurance. Many chaebols are known for vertical integration. They often control the entire supply chain, from raw materials to finished products, ensuring reduced costs and greater markert.

    While chaebols have been instrumental in South Korea’s economic success, they haven’t been without controversies. The power and wealth concentrated in a few chaebols have sometimes stymied the growth of small and medium-sized businesses. Due to their complex structures and family dominance, issues of corporate governance, transparency, and fair trade practices have been raised. Over the years, several chaebols have been embroiled in political scandals, raising concerns about their influence on political decisions. For many people the nut rage incident where Korean Air vice president Heather Cho dissatisfied with the way a flight attendant served nuts on the plane, ordered the aircraft to return to the gate before takeoff , highlights the power chaebols have.


    Economic inequality, a universal challenge, has emerged as a focal point of discussion in South Korea, a nation renowned for its remarkable post-war economic transformation. While the “Miracle on the Han River” narrates a story of astounding growth, there’s a less talked about subplot – widening economic disparities.

    South Korea was the 5th most equal country in the world in 2019, however economic inequality is growing. According to data from 2010, low-income earners (those earning 12 million won or less) make up 37.8% of South Korea’s labour force. However, among other countries in OECD, South Korea performs relatively well when considering indicators such as the Gini coefficient and Palma ratio, especially when limiting the comparison to countries with similar populations

    Income disparity in South Korea has been growing. The top 10% of income earners in the country make around 45% more than the bottom 10%. The implications of this gap manifest in various ways, from access to quality education and healthcare to overall life satisfaction and social mobility.

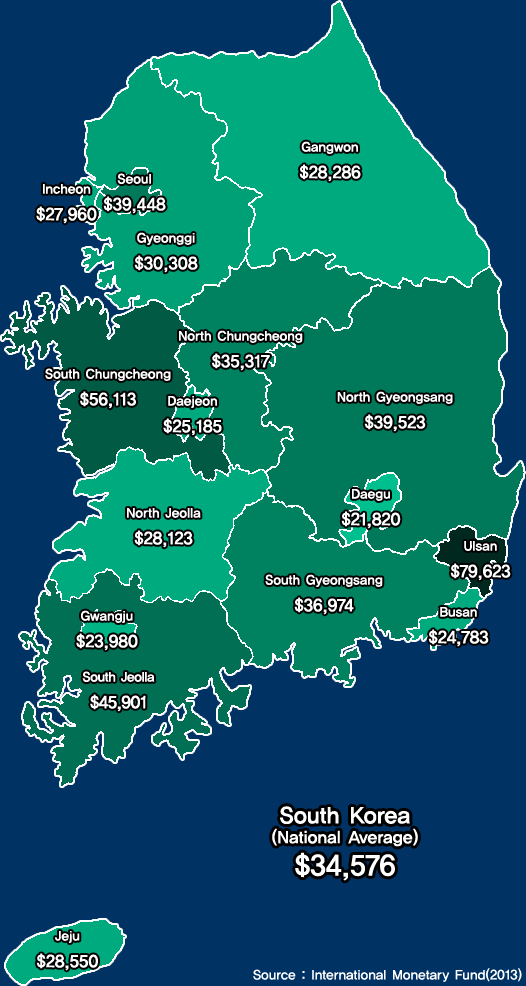
    Regional disparities also exists in South Korea. Seoul and its neighboring regions, being the epicenters of commerce and industry, have seen greater growth than other parts of the country, leading to noticeable regional economic imbalances.

    Figure above shows regional disparities in South Korea.

    There is a generation gap in South Korea. Young South Koreans, despite being more educated than previous generations, face challenges like underemployment, precarious job security, and rising housing costs. On the other hand, the elderly population, which has grown due to increased life expectancy, faces poverty rates that are alarmingly high by OECD standards. The social safety net in South Korea is less comprehensive than in many other developed nations. This has particularly affected the elderly population, leading to high levels of elderly poverty.

    Real estate in South Korea, especially in Seoul, has seen skyrocketing prices, making homeownership an unattainable dream for many young people. Speculative investments in property have further exacerbated this issue. Economic inequality is often linked to low or limited social mobility, a situation which may instill a sense of hopelessness among South Korea’s youth. Gambling, though extremely limited due to its legality in South Korea, can be a dangerous source of debt for South Koreans who are susceptible to gambling and gambling addiction. In 2017, the availability of cryptocurrency in South Korea,combined with a lack of legal outlets for gambling, has contributed to gambling problems and associated deb

    South Korea’s labor market is characterized by a divide between regular and non-regular workers. Non-regular workers, despite making up a substantial portion of the workforce, face lower wages, less job security, and fewer benefits.

    Overall GDP by section can be summarized as agriculture: 2.2%industry: 39.3%services: 58.3%(2017 est.)

    Shipbuilding

    Shipbuilding-During the 1970s and 1980s, South Korea became a leading producer of ships, including oil supertankers, and oil-drilling platforms. The country’s major shipbuilder was Hyundai, which built a 1-million-ton capacity drydock at Ulsan in the mid-1970s. Daewoo joined the shipbuilding industry in 1980 and finished a 1.2-million-ton facility at Okpo on Geoje Island, south of Busan, in mid-1981.


    The industry declined in the mid-1980s because of the oil glut and because of a worldwide recession. There was a sharp decrease in new orders in the late 1980s; new orders for 1988 totaled 3 million gross tons valued at US$1.9 billion, decreases from the previous year of 17.8 percent and 4.4 percent, respectively. These declines were caused by labor unrest, Seoul’s unwillingness to provide financial assistance, and Tokyo’s new low-interest export financing in support of Japanese shipbuilders. However, the South Korean shipping industry was expected to expand in the early 1990s because older ships in world fleets needed replacing. South Korea eventually became the world’s dominant shipbuilder with a 50.6% share of the global shipbuilding market as of 2008. Notable Korean shipbuilders are Hyundai Heavy Industries, Samsung Heavy Industries, Daewoo Shipbuilding & Marine Engineering, and the now bankrupt STX Offshore & Shipbuilding.

    Electronics

    Electronics is one of South Korea’s main industries. During the 1980s through the 2000s, South Korean companies such as Samsung, LG and SK led South Korea’s growth. In 2017, 17.1% of South Korea’s exports were semiconductors produced by Samsung Electronics and SK Hynix. Samsung and

    LG are also major producers in electronic devices such as televisions, smartphones, display, and computers.

    Automobiles

    The automobile industry was one of South Korea’s major growth and export industries in the 1980s. By the late 1980s, the capacity of the South Korean motor industry had increased more than fivefold since 1984; it exceeded 1 million units in 1988. Total investment in car and car-component manufacturing was over US$3 billion in 1989. In 1988 automobile exports totaled 576,134 units, of which 480,119 units (83.3 percent) were sent to the United States.

    Throughout most of the late 1980s, much of the growth of South Korea’s automobile industry was the result of a surge in exports; 1989 exports, however, declined 28.5 percent from 1988. This decline reflected sluggish car sales to the United States, especially at the less expensive end of the market, and labor strife at home. South Korea today has developed into one of the world’s largest automobile producers. The Hyundai Kia Automotive Group is South Korea’s largest automaker in terms of revenue, production units and worldwide presence.

    Mining

    Most of the mineral deposits in the Korean Peninsula are located in North Korea, with the South only possessing an abundance of tungsten and graphite. Coal, iron ore, and molybdenum are found in South Korea, but not in large quantities and mining operations are on a small scale. Much of South Korea’s minerals and ore are imported from other countries. Most South Korean coal is anthracite that is only used for heating homes and boilers.


    In 2019, South Korea was the 3rd largest world producer of bismuth, the 4th largest world producer of rhenium, and the 10th largest world producer of sulfur.

    Construction

    Construction has been an important South Korean export industry since the early 1960s and remains a critical source of foreign currency and invisible export earnings. By 1981 overseas construction projects, most of them in the Middle East, accounted for 60 percent of the work undertaken by South Korean construction companies.

    South Korean construction companies concentrated on the rapidly growing domestic market in the late 1980s. By 1989 there were signs of a revival of the overseas construction market: the Dong Ah Construction Company signed a US$5.3 billion contract with Libya to build the second phase of Libya’s Great Man-Made River Project, with a projected cost of US$27 billion when all 5 phases were completed. South Korean construction companies signed over US$7 billion of overseas contracts in 1989. Korea’s largest construction companies include Samsung C&T Corporation, which built some of the highest building’s and most noteworthy skyscrapers such as three consecutively world’s tallest buildings: Petronas Towers, Taipei 101, and Burj Khalifa.

    Armaments

    Since the 1980s, South Korea has begun exporting military equipment and technology to boost its international trade. South Korea also exports various core components of other countries’ advanced military hardware. Those hardware include modern aircraft such as F-15K fighters and AH-64 attack helicopters which will be used by Singapore. In other major outsourcing and joint-production deals, South Korea has jointly produced the S-300 air defense system of Russia via Samsung Group. South Korea’s defense exports were $1.03 billion in 2008 and $1.17 billion in 2009

    Tourism

    In 2012, 11.1 million foreign tourists visited South Korea, making it one of the most visited countries in the world, up from 8.5 million in 2010. Many tourists from all around Asia visit South Korea which has been due to the rise of Korean Wave (Hallyu).Seoul is the principal tourist destination for visitors; popular tourist destinations outside of Seoul include Seorak-san national park, the historic city of Gyeongju and semi-tropical Jeju Island.

    Overall

    South Korea relies upon exports to fuel the growth of its economy, with finished products such as electronics, textiles, ships, automobiles, and steel being some of its most important exports. Although the import market has liberalized in recent years, the agricultural market has remained protectionist due to disparities in the price of domestic agricultural products such as rice with the international market. As of 2005, the price of rice in South Korea was four times that of the average price of rice on the international market, and it was believed that opening the agricultural market would affect South Korean agricultural sector negatively. In late 2004, however, an agreement was reached with the WTO in which South Korean rice imports will gradually increase from 4% to 8% of consumption by 2014. In addition, up to 30% of imported rice will be made available directly to consumers by 2010, where previously imported rice was only used for processed foods. Following 2014, the South Korean rice market will be fully opened

    South Korea established an export-oriented economic structure centered on large businesses while pursuing growth in the face of insufficient capital and resources. This led conglomerates to dominate industry, making the economic structure heavily reliant on exports and imports, thus leaving the country susceptible to external economic conditions.

    Most Exported goods are : Integrated Circuits 15.35%, Machinery 12.81%, Vehicles and their parts 11.34%, Mineral Fuels 7.01%, Plastics 5.86%, Iron and Steel 4.23%, Instruments and Apparatus 4.16%, Organic Chemicals 3.85%, Others 35.39%(2019 estm.)


    Export-driven: South Korea is the 10th largest exporter in the world. Major exports include semiconductors, petrochemicals, automobiles, and ships. Its ability to innovate and adapt to global market needs has been a significant factor in its export success.

    Innovation and Technology: South Korea is a global leader in various high-tech industries. The country boasts the world’s highest broadband penetration, and its firms lead in sectors like mobile technology, semiconductors, and OLED display production.

    Chaebols: These conglomerates still play a dominant role in the South Korean economy. While they have been catalysts for growth, they also raise concerns related to corporate governance, competition, and economic disparity.

    Education: South Koreans place a high emphasis on education, resulting in a highly skilled and competitive workforce. The country consistently ranks high in global education indices.

    Demographics: South Korea has one of the world’s lowest fertility rates. A rapidly aging population puts a strain on the social security system and can lead to potential labor shortages.

    Dependency on Exports: While exports have driven growth, over-dependency makes the economy vulnerable to global market fluctuations.

    Inter-Korean Relations: Political and military tensions with North Korea have implications for investor confidence and regional stability.

    Corporate Governance: While reforms post the 1997 crisis have been implemented, there are still concerns about transparency and accountability within the chaebols.

    Challenges also include an aging population, low worker productivity, and the need to implement a structural shift away from overreliance on export-led growth and expansionary fiscal policy.

    South Korea’s economic transformation over the past six decades is nothing short of miraculous. A mix of strategic state interventions, entrepreneurial spirit, cultural emphasis on education, and adaptability has propelled the country into the ranks of advanced economies. However, as with all nations, South Korea faces challenges that it must address to ensure continued prosperity. With its track record of overcoming adversity, the South Korean economy’s future remains promising.


    Country/RegionExport (M$)Percentage
     China162,12526.8%
     United States72,72012.0%
     Vietnam48,6228.0%
     Hong Kong45,9967.6%
     Japan30,5295.1%
     Russia20,8723.4%
     Taiwan20,7843.2%
     India15,6062.6%
     Philippines12,0372.0%
     Singapore11,7822.0%
     Mexico11,4581.9%
    Others173,20128.6%
    Total604,860100.0%
    Country/RegionImport (M$)Percentage
     China106,48919.9%
     United States58,86811.0%
     Japan54,60410.2%
     Saudi Arabia26,3364.9%
     Germany20,8543.9%
     Australia20,7193.9%
     Vietnam19,6433.7%
     Russia17,5043.4%
     Taiwan16,7383.1%
     Qatar16,2943.0%
     Singapore12,7622.0%
    Others177,15333.1%
    Total535,202100.0%

    The South Korean Economy: A Story of Remarkable Transformation and Resilience

    South Korea, officially known as the Republic of Korea (ROK), presents an intriguing case study in economic development. From the ravages of the Korean War to becoming an economic powerhouse, the South Korean economy’s journey is a testament to a combination of strategic planning, relentless hard work, and innovative spirit.

    From its humble beginning the countries economy had grown to a nominal GDP of ₩2.24 quadrillion (US$1.72 trillion) making it the 4th largest economy in Asia and the 12th largest in the world

    Part of the OECD and the G20. South Korea’s education system and an educated and motivated population was largely responsible for the technology boom and economic development in the country. South Korea adapted an export-oriented economic strategy to fuel its economy. In 2019, South Korea was the eight largest exporter and eight largest importer in the world.

    Financial organizations, such as the international monetary fund comments that the South Korean economy is resilient against various economic crises. They country’s economic advantages such as its low state debt, and high fiscal reserves and its country’s major economic output being the technology products exports is the reason behind this resilience.

    However, despite the South Korean economy’s high growth and structural stability, the credit rating of the country is damaged in the stock market due to North Korea in times of military crisis. The recurring conflict affects the financial markets of its economy

    The Beginning

    The foundation of the South Korean economic story is deeply rooted in its tumultuous history. After gaining independence from Japan in 1945, Korea was split into North and South. The Korean War (1950-1953) devastated the South Korean economy, leaving it as one of the poorest countries in the world.

    However, South Korea only remained a country with less developed markets for a little more than a decade after the Korean war.


    The principal reason behind the growth of the South Korea’s economic development is the industrial sector. Due to strong domestic encouragement and some foreign aid, Seoul’s industrialists introduced modern technologies into outmoded or newly built facilities, increased the production of commodities especially those for sale in foreign markets and invested the proceeds back into further industrial expansion. As a result, industry altered South Korea’s landscape, drawing millions of labourers to urban manufacturing centres.

    The Miracle on the Han River

    In the beginning in the 1960s, under the leadership of Park Chung-hee, South Korea underwent rapid industrialization and modernization, an era often referred to as the “Miracle on the Han River.”

    The government instituted comprehensive reforms and laid the groundwork for an export-driven economy. To promote development, a policy of export oriented industrialization was applied, closing the entry into the country of all kinds of foreign products, except raw materials. Major industries, such as steel, shipbuilding, and chemicals, were heavily promoted. Infrastructure, education, and R&D became vital investment areas.

    The 1970s and 1980s saw the rise of family-controlled conglomerates, or “chaebols,” like Samsung, Hyundai, and LG. Their growth was often backed by government policies, and they became significant players in driving South Korea’s economic expansion.

    Through the model of export-led industrialization, the government incentigvized corporations to develop new technology and upgrade productive efficiency to compete the global market. By adhering to state regulations and demands, firms were awarded subsidization and investment support to develop their export markets in the evolving international arena. The chaebols received state incentives such as tax breaks, legality for their exploitation system and cheap or free financing In addition, the inflow of foreign capital was encouraged to supplement the shortage of domestic savings. These efforts enabled South Korea to achieve growth in exports and subsequent increases in income.

    By emphasizing the industrial sector, Seoul’s export-oriented development strategy left the rural sector barely touched. The steel and shipbuilding industries in particular played key roles in developing South Korea’s economy during this time.

    The Asian financial crisis and its aftermath


    In 1997, South Korea, along with many Asian nations, faced a severe financial crisis. The chaebols’ excessive borrowing and a fixed exchange rate regime were among the primary reasons for South Korea’s vulnerability. The crisis led to significant economic restructuring, with the International Monetary Fund (IMF) providing a $58 billion bailout package.

    Hosting the 1988 Summer Olympic Games, commonly known as Seoul 1988, provided the country with the momentum to join the ranks of semi-advanced countries. The overseas mass media called South Korea one of the four Asian tigers along with Taiwan, Singapore, and Hong Kong. In December 1996, the country became the 29th member country of the OECD, which is largely composed of advanced countries.

    In response, the South Korean government implemented stringent reforms, including financial sector liberalization, corporate governance reforms, and the restructuring of chaebols. By 2001, the country had remarkably bounced back, with its economy growing at 4%.

    High-tech industries in the 1990s and 2000s

    In 1990, South Korean manufacturers planned a shift in future production toward high-technology industries. In June 1989, panels of government officials, scholars, and business leaders held planning sessions on the production of such goods as new materials, mechatronics, bioengineering, microelectronics, fine chemistry, and aerospace.

    This shift did not mean an immediate decline in heavy industries such as automobile and ship production, which had dominated the economy in the 1980s.

    In November 1997, a foreign exchange crisis hit the country, forcing it to turn to the IMF for a bailout. It was the first ordeal the country had to confront after years of rapid economic growth. The country took the drastic step to drive insolvent businesses out of the market and then pushed ahead with industrial restructuring. In only two years, the country regained its previous growth rate and price levels as well as a current account balance surplus. In the process, some 3.5 million people joined in the campaign to collect gold to help the government repay the fund borrowed from the IMF. A total of 227 tons of gold were collected. The world marveled at the South Koran people’s voluntary participation in the determined effort to repay its national debts

    South Korea today is known as a Launchpad of a mature mobile market, where developers thrive in a market where few technology constraints exist. There is a growing trend of inventions of new types of media or apps, using the 4G and 5G internet infrastructure in South Korea. South Korea has today the infrastructures to meet a density of population and culture that has the capability to create strong local particularity. The country has displayed global competitiveness in various fields such as mobile phones, semiconductors, automobiles, chemicals, and steelmaking. In recent years, its cultural content, including music, gaming, and webtoons, is emerging as an essential industry in itself, taking the lead in the Korean economy.


    The chaebols are large family-owned business conglomerates that dominate South Korea’s economic, political, and social life. Their roots trace back to the 1960s and 70s when South Korea, under the leadership of then-president Park Chung-hee, embarked on an ambitious plan of industrialization. The government formed strategic partnerships with select business groups, offering them financial incentives, cheap loans, and protection from competition in exchange for their commitment to the national industrialization effort.

    At the heart of every chaebol is a founding family. The typical culture at one of these conglomerates is highly paternalistic. Much of the environment is defined by the chairman who acts as a “fatherly figure” to his subordinates. Workers commit to long hours, most notably on weekends and holidays, to appease their superiors. Company outings and drinking sessions tend to be compulsory to foster a sense of family and belonging among employees. Employers believe that enhancing a common bond between them would translate into prosperity and productivity for the company. Other practices that would be uncommon for Western workplaces to engage in include gift-giving to employees and arranging dates for workers in search of relationships or marriage.

    Chaebols are notoriously hierarchical. As such, it is unusual for an individual to challenge or question the decision-making of his or her boss. Promotion is rarely merit-based. Rather, it is through the order of age and time served to the conglomerate. If a worker does not attain an executive or senior-management role by the age of fifty, he or she is commonly forced to resign.

    Because of South Korea’s long-lasting relationship with chaebols, South Korea has always suppressed and ignored labour unions. As of 2019, there are only two legally recognized labour unions in South Korea: The Federation of Korean Trade Unions and the Korean Confederation of Trade Unions. Despite these unions’ attempts at reform, the South Korean government does not take many actions. If a union oversteps and openly criticizes a chaebol, it faces serious repercussions, as chaebols are essentially government entities. It is well known that chaebols evade taxes regularly.  

    Many South Korean family-run chaebols have been criticized for low dividend payouts and other governance practices that favor controlling shareholders at the expense of ordinary investors. Because of their major role in the Korean stock market, foreign investors play a massive part in whether or not chaebol conglomerates remain financially successful.

    Foreign investors tend to avoid chaebols, especially those that displayed heavy political influence in South Korea, like Samsung and Hyundai. Investors are reluctant to invest in large control-ownership disparity businesses because these companies tended to cheat shareholders to have higher personal financial gain. A study published in the Journal of the Japanese and International Economies found that after the 1997 Asian financial crisis, foreign investment behavioural patterns changed drastically. While foreign investors like to hold shares in large companies with high profit and liquidity margins, they do not show any particular interest in either chaebol or non-chaebol companies. Nonetheless, chaebols are still able to survive, highlighting just how much power and aid they receive from the Korean government. All but 3 of the top 50 firms listed on the Korean Stock Exchange are designated as chaebols, and despite chaebols only accounting for just over 10 percent of the country’s workers, the four largest chaebols hold 70 percent of total market capitalization, and all chaebols together holding 77 percent as of the late 2010s.

    Even though they might hold a minor stake in terms of shares, they exercise considerable control through a complex web of cross-shareholdings among subsidiary companies. One of the characteristics of a Chaebols is diversification meaning have a diverse range of businesses. For instance, Samsung, initially a trading company, has expanded into electronics, shipbuilding, construction, insurance. Many chaebols are known for vertical integration. They often control the entire supply chain, from raw materials to finished products, ensuring reduced costs and greater markert.

    While chaebols have been instrumental in South Korea’s economic success, they haven’t been without controversies. The power and wealth concentrated in a few chaebols have sometimes stymied the growth of small and medium-sized businesses. Due to their complex structures and family dominance, issues of corporate governance, transparency, and fair trade practices have been raised. Over the years, several chaebols have been embroiled in political scandals, raising concerns about their influence on political decisions. For many people the nut rage incident where Korean Air vice president Heather Cho dissatisfied with the way a flight attendant served nuts on the plane, ordered the aircraft to return to the gate before takeoff , highlights the power chaebols have.


    Economic inequality, a universal challenge, has emerged as a focal point of discussion in South Korea, a nation renowned for its remarkable post-war economic transformation. While the “Miracle on the Han River” narrates a story of astounding growth, there’s a less talked about subplot – widening economic disparities.

    South Korea was the 5th most equal country in the world in 2019, however economic inequality is growing. According to data from 2010, low-income earners (those earning 12 million won or less) make up 37.8% of South Korea’s labour force. However, among other countries in OECD, South Korea performs relatively well when considering indicators such as the Gini coefficient and Palma ratio, especially when limiting the comparison to countries with similar populations

    Income disparity in South Korea has been growing. The top 10% of income earners in the country make around 45% more than the bottom 10%. The implications of this gap manifest in various ways, from access to quality education and healthcare to overall life satisfaction and social mobility.

    Regional disparities also exists in South Korea. Seoul and its neighboring regions, being the epicenters of commerce and industry, have seen greater growth than other parts of the country, leading to noticeable regional economic imbalances.

    Figure above shows regional disparities in South Korea.

    There is a generation gap in South Korea. Young South Koreans, despite being more educated than previous generations, face challenges like underemployment, precarious job security, and rising housing costs. On the other hand, the elderly population, which has grown due to increased life expectancy, faces poverty rates that are alarmingly high by OECD standards. The social safety net in South Korea is less comprehensive than in many other developed nations. This has particularly affected the elderly population, leading to high levels of elderly poverty.

    Real estate in South Korea, especially in Seoul, has seen skyrocketing prices, making homeownership an unattainable dream for many young people. Speculative investments in property have further exacerbated this issue. Economic inequality is often linked to low or limited social mobility, a situation which may instill a sense of hopelessness among South Korea’s youth. Gambling, though extremely limited due to its legality in South Korea, can be a dangerous source of debt for South Koreans who are susceptible to gambling and gambling addiction. In 2017, the availability of cryptocurrency in South Korea,combined with a lack of legal outlets for gambling, has contributed to gambling problems and associated deb

    South Korea’s labor market is characterized by a divide between regular and non-regular workers. Non-regular workers, despite making up a substantial portion of the workforce, face lower wages, less job security, and fewer benefits.

    Overall GDP by section can be summarized as agriculture: 2.2%industry: 39.3%services: 58.3%(2017 est.)

    Shipbuilding

    Shipbuilding-During the 1970s and 1980s, South Korea became a leading producer of ships, including oil supertankers, and oil-drilling platforms. The country’s major shipbuilder was Hyundai, which built a 1-million-ton capacity drydock at Ulsan in the mid-1970s. Daewoo joined the shipbuilding industry in 1980 and finished a 1.2-million-ton facility at Okpo on Geoje Island, south of Busan, in mid-1981.


    The industry declined in the mid-1980s because of the oil glut and because of a worldwide recession. There was a sharp decrease in new orders in the late 1980s; new orders for 1988 totaled 3 million gross tons valued at US$1.9 billion, decreases from the previous year of 17.8 percent and 4.4 percent, respectively. These declines were caused by labor unrest, Seoul’s unwillingness to provide financial assistance, and Tokyo’s new low-interest export financing in support of Japanese shipbuilders. However, the South Korean shipping industry was expected to expand in the early 1990s because older ships in world fleets needed replacing. South Korea eventually became the world’s dominant shipbuilder with a 50.6% share of the global shipbuilding market as of 2008. Notable Korean shipbuilders are Hyundai Heavy Industries, Samsung Heavy Industries, Daewoo Shipbuilding & Marine Engineering, and the now bankrupt STX Offshore & Shipbuilding.

    Electronics

    Electronics is one of South Korea’s main industries. During the 1980s through the 2000s, South Korean companies such as Samsung, LG and SK led South Korea’s growth. In 2017, 17.1% of South Korea’s exports were semiconductors produced by Samsung Electronics and SK Hynix. Samsung and

    LG are also major producers in electronic devices such as televisions, smartphones, display, and computers.

    Automobiles

    The automobile industry was one of South Korea’s major growth and export industries in the 1980s. By the late 1980s, the capacity of the South Korean motor industry had increased more than fivefold since 1984; it exceeded 1 million units in 1988. Total investment in car and car-component manufacturing was over US$3 billion in 1989. In 1988 automobile exports totaled 576,134 units, of which 480,119 units (83.3 percent) were sent to the United States.

    Throughout most of the late 1980s, much of the growth of South Korea’s automobile industry was the result of a surge in exports; 1989 exports, however, declined 28.5 percent from 1988. This decline reflected sluggish car sales to the United States, especially at the less expensive end of the market, and labor strife at home. South Korea today has developed into one of the world’s largest automobile producers. The Hyundai Kia Automotive Group is South Korea’s largest automaker in terms of revenue, production units and worldwide presence.

    Mining

    Most of the mineral deposits in the Korean Peninsula are located in North Korea, with the South only possessing an abundance of tungsten and graphite. Coal, iron ore, and molybdenum are found in South Korea, but not in large quantities and mining operations are on a small scale. Much of South Korea’s minerals and ore are imported from other countries. Most South Korean coal is anthracite that is only used for heating homes and boilers.


    In 2019, South Korea was the 3rd largest world producer of bismuth, the 4th largest world producer of rhenium, and the 10th largest world producer of sulfur.

    Construction

    Construction has been an important South Korean export industry since the early 1960s and remains a critical source of foreign currency and invisible export earnings. By 1981 overseas construction projects, most of them in the Middle East, accounted for 60 percent of the work undertaken by South Korean construction companies.

    South Korean construction companies concentrated on the rapidly growing domestic market in the late 1980s. By 1989 there were signs of a revival of the overseas construction market: the Dong Ah Construction Company signed a US$5.3 billion contract with Libya to build the second phase of Libya’s Great Man-Made River Project, with a projected cost of US$27 billion when all 5 phases were completed. South Korean construction companies signed over US$7 billion of overseas contracts in 1989. Korea’s largest construction companies include Samsung C&T Corporation, which built some of the highest building’s and most noteworthy skyscrapers such as three consecutively world’s tallest buildings: Petronas Towers, Taipei 101, and Burj Khalifa.

    Armaments

    Since the 1980s, South Korea has begun exporting military equipment and technology to boost its international trade. South Korea also exports various core components of other countries’ advanced military hardware. Those hardware include modern aircraft such as F-15K fighters and AH-64 attack helicopters which will be used by Singapore. In other major outsourcing and joint-production deals, South Korea has jointly produced the S-300 air defense system of Russia via Samsung Group. South Korea’s defense exports were $1.03 billion in 2008 and $1.17 billion in 2009

    Tourism

    In 2012, 11.1 million foreign tourists visited South Korea, making it one of the most visited countries in the world, up from 8.5 million in 2010. Many tourists from all around Asia visit South Korea which has been due to the rise of Korean Wave (Hallyu).Seoul is the principal tourist destination for visitors; popular tourist destinations outside of Seoul include Seorak-san national park, the historic city of Gyeongju and semi-tropical Jeju Island.

    Overall

    South Korea relies upon exports to fuel the growth of its economy, with finished products such as electronics, textiles, ships, automobiles, and steel being some of its most important exports. Although the import market has liberalized in recent years, the agricultural market has remained protectionist due to disparities in the price of domestic agricultural products such as rice with the international market. As of 2005, the price of rice in South Korea was four times that of the average price of rice on the international market, and it was believed that opening the agricultural market would affect South Korean agricultural sector negatively. In late 2004, however, an agreement was reached with the WTO in which South Korean rice imports will gradually increase from 4% to 8% of consumption by 2014. In addition, up to 30% of imported rice will be made available directly to consumers by 2010, where previously imported rice was only used for processed foods. Following 2014, the South Korean rice market will be fully opened

    South Korea established an export-oriented economic structure centered on large businesses while pursuing growth in the face of insufficient capital and resources. This led conglomerates to dominate industry, making the economic structure heavily reliant on exports and imports, thus leaving the country susceptible to external economic conditions.

    Most Exported goods are : Integrated Circuits 15.35%, Machinery 12.81%, Vehicles and their parts 11.34%, Mineral Fuels 7.01%, Plastics 5.86%, Iron and Steel 4.23%, Instruments and Apparatus 4.16%, Organic Chemicals 3.85%, Others 35.39%(2019 estm.)


    Export-driven: South Korea is the 10th largest exporter in the world. Major exports include semiconductors, petrochemicals, automobiles, and ships. Its ability to innovate and adapt to global market needs has been a significant factor in its export success.

    Innovation and Technology: South Korea is a global leader in various high-tech industries. The country boasts the world’s highest broadband penetration, and its firms lead in sectors like mobile technology, semiconductors, and OLED display production.

    Chaebols: These conglomerates still play a dominant role in the South Korean economy. While they have been catalysts for growth, they also raise concerns related to corporate governance, competition, and economic disparity.

    Education: South Koreans place a high emphasis on education, resulting in a highly skilled and competitive workforce. The country consistently ranks high in global education indices.

    Demographics: South Korea has one of the world’s lowest fertility rates. A rapidly aging population puts a strain on the social security system and can lead to potential labor shortages.

    Dependency on Exports: While exports have driven growth, over-dependency makes the economy vulnerable to global market fluctuations.

    Inter-Korean Relations: Political and military tensions with North Korea have implications for investor confidence and regional stability.

    Corporate Governance: While reforms post the 1997 crisis have been implemented, there are still concerns about transparency and accountability within the chaebols.

    Challenges also include an aging population, low worker productivity, and the need to implement a structural shift away from overreliance on export-led growth and expansionary fiscal policy.

    South Korea’s economic transformation over the past six decades is nothing short of miraculous. A mix of strategic state interventions, entrepreneurial spirit, cultural emphasis on education, and adaptability has propelled the country into the ranks of advanced economies. However, as with all nations, South Korea faces challenges that it must address to ensure continued prosperity. With its track record of overcoming adversity, the South Korean economy’s future remains promising.


    Country/RegionExport (M$)Percentage
     China162,12526.8%
     United States72,72012.0%
     Vietnam48,6228.0%
     Hong Kong45,9967.6%
     Japan30,5295.1%
     Russia20,8723.4%
     Taiwan20,7843.2%
     India15,6062.6%
     Philippines12,0372.0%
     Singapore11,7822.0%
     Mexico11,4581.9%
    Others173,20128.6%
    Total604,860100.0%
    Country/RegionImport (M$)Percentage
     China106,48919.9%
     United States58,86811.0%
     Japan54,60410.2%
     Saudi Arabia26,3364.9%
     Germany20,8543.9%
     Australia20,7193.9%
     Vietnam19,6433.7%
     Russia17,5043.4%
     Taiwan16,7383.1%
     Qatar16,2943.0%
     Singapore12,7622.0%
    Others177,15333.1%
    Total535,202100.0%

    Dividends 101

    What Is a Dividend?

    A dividend is the distribution of some of a company’s earnings to a class of its shareholders, as determined by the company’s board of directors. Common shareholders of dividend-paying companies are typically eligible as long as they own the stock before the ex-dividend date. Dividends may be paid out as cash or in the form of additional stock or other property. Along with companies, various mutual funds and exchange-traded funds (ETF) also pay dividends.

    A dividend is a token reward paid to the shareholders for their investment in a company’s equity, and it usually originates from the company’s net profits. While the major portion of the profits is kept within the company as retained earnings–which represent the money to be used for the company’s ongoing and future business activities–the remainder can be allocated to the shareholders as a dividend. At times, companies may still make dividend payments even when they don’t make suitable profits. They may do so to maintain their established track record of making regular dividend payments.

    The board of directors can choose to issue dividends over various time frames and with different payout rates. Dividends can be paid at a scheduled frequency, such as monthly, quarterly or annually.

    Companies that pay dividends

    Companies can also issue non-recurring special dividends either individually or in addition to a scheduled dividend. Backed by strong business performance and an improved financial outlook,  for instance Microsoft Corp (MSFT) declared a special dividend of $3.00 per share in 2004, which was way above the usual quarterly dividends in the range of $0.08 to $0.16 per share.

    Larger, more established companies with more predictable profits are often the best dividend payers. These companies tend to issue regular dividends because they seek to maximize shareholder wealth in ways aside from normal growth. Companies in the following industry sectors are observed to be maintaining a regular record of dividend payments: Basic materials, Oil and gas, Banks and financial, Healthcare and pharmaceuticals and Utilities. Companies structured as master limited partnership (MLP) and real estate investment trust (REIT) are also top dividend payers since their designations require specified distributions to shareholders.

    Certain dividend-paying companies may go as far as establishing dividend payout targets, which are based on generated profits in a given year. For example, banks typically pay out a certain percentage of their profits in the form of cash dividends. If profits decline, dividend policy can be postponed to better times.

    Start-ups and other high-growth companies, such as those in the technology or biotech sectors, may not offer regular dividends.


    Because these companies may be in the early stages of development and may incur high costs (as well as losses) attributed to research and development, business expansion and operational activities, they may not have sufficient funds to issue dividends. Even profit-making early- to mid-stage companies avoid making dividend payments if they are aiming for higher-than-average growth and expansion, and want to invest their profits back into their business rather than paying dividends. The business growth cycle partially explains why growth firms do not pay dividends; they need these funds to expand their operations, build factories and increase their personnel.

    Important Dividend Dates

    Dividend payments follow a chronological order of events and the associated dates are important to determine the shareholders who qualify for receiving the dividend payment.

    • Announcement Date: Dividends are announced by company management on the announcement date,  and must be approved by the shareholders before they can be paid. Any change in the expected dividend payment can cause the stock to rise or fall quickly as traders adjust to new expectations. The ex-dividend date and record date will occur after the declaration date. Once a dividend is declared on the announcement date, the company has a legal responsibility to pay it.
    • Ex-Dividend Date: The date on which the dividend eligibility expires is called the ex-dividend date or simply the ex-date. For instance, if a stock has an ex-date of Monday, May 5, then shareholders who buy the stock on or after that day will NOT qualify to get the dividend as they are buying it on or after the dividend expiry date. Shareholders who own the stock one business day prior to the ex-date – that is on Friday, May 2, or earlier – will receive the dividend. The value of a share of stock goes down by about the dividend amount when the stock goes ex-dividend.
    • Record Date: The record date is the cut-off date, established by the company in order to determine which shareholders are eligible to receive a dividend or distribution.
    • Payment Date: The company issues the payment of the dividend on the payment date which is when the money gets credited to investors’ accounts.

    The dividend may rise on the announcement approximately by the amount of the dividend declared and then decline by a similar amount at the opening session of the ex-dividend date.

    For example, a company that is trading at $50 per share declares a $5 dividend on the announcement date. As soon as the news becomes public, the share price shoots up by around $5 and hit $55. Say the stock trades at $52 one business day prior to the ex-dividend date. On the ex-dividend date, it comes down by a similar $5 and begins trading at $50 at the start of the trading session on the ex-dividend date, because anyone buying on the ex-dividend date will not receive the dividend.

    Why companies pay dividend

    Companies pay dividends for a variety of reasons. Dividends can be expected by the shareholders as a reward for their trust in a company. The company management may aim to honor this sentiment by delivering a robust track record of dividend payments. Dividend payments reflect positively on a company and help maintain investors’ trust.


    A high-value dividend declaration can indicate that the company is doing well and has generated good profits. But it can also indicate that the company does not have suitable projects to generate better returns in the future. Therefore, it is utilizing its cash to pay shareholders instead of reinvesting it into growth

    One of the simplest ways for companies to foster goodwill among their shareholders, drive demand for the stock, and communicate financial well-being and shareholder value is through paying dividends. Paying dividends sends a message about a company’s future prospects and performance. Its willingness and ability to pay steady dividends over time provides a solid demonstration of financial strength. Mature firms that believe they can increase value by reinvesting their earnings will choose not to pay dividends.

    If a company has a long history of dividend payments, a reduction of the dividend amount, or its elimination, may signal to investors that the company is in trouble. The announcement of a 50% decrease in dividends from General Electric Co. (GE), one of the biggest American industrial companies, was accompanied by a decline of more than six percent in GE’s stock price on November 13, 2017.

    A reduction in dividend amount or a decision against making any dividend payment may not necessarily translate into bad news about a company. It may be possible that the company’s management has better plans for investing the money, given its financials and operations. For example, a company’s management may choose to invest in a high-return project that has the potential to magnify returns for shareholders in the long run, as compared to the petty gains they will realize through dividend payments.

    It could be when the pricing and conditions are just right for a stock buyback; weathering a major recession becomes the priority; or a company needs to accumulate cash on hand for a big merger or acquisition. 

    Forms of dividend

    A cash dividend is a payment doled out by a company to its stockholders in the form of periodic distributions of cash. Most brokers offer a choice to accept or reinvest cash dividends; reinvesting dividends is often a smart choice for investors with a long-term focus.

    A stock dividend is a dividend payment to shareholders that is made in shares rather than as cash. The stock dividend has the advantage of rewarding shareholders without reducing the company’s cash balance, although it can dilute earnings per share. This type of dividend may be made when a company wants to reward its investors but doesn’t have the spare cash or wants to preserve its cash for other investments. This, however, like the cash dividend, does not increase the value of the company. If the company was priced at $10 per share, the value of the company would be $10 million. After the stock dividend, the value will remain the same, but the share price will decrease to $9.52 to adjust for the dividend payout.

    Stock dividends can have a negative impact on share price in the short-term. Because it increases the number of shares outstanding while the value of the company remains stable, it dilutes the book value per common share, and the stock price is reduced accordingly.

    Fund Dividends v. Company dividends

    Dividends paid by funds are different from dividends paid by companies. Company dividends are usually paid from profits that are generated from the company’s business operations. Funds work on the principle of net asset value (NAV), which reflects the valuation of their holdings or the price of the asset(s) that a fund may be tracking. Since funds don’t have any intrinsic profits, they pay dividends sourced from their NAV.

    Due to the NAV-based working of funds, regular and high-frequency dividend payments should not be misunderstood as a stellar performance by the fund. For example, a bond-investing fund may pay monthly dividends as it receives money in the form of monthly interest on its interest-bearing holdings. The fund is merely transferring the income from the interest fully or partially to the fund investors. A stock-investing fund may also pay dividends. Its dividends may come from the dividend(s) it receives from the stocks held in its portfolio, or by selling a certain quantity of stocks. It’s likely the investors receiving the dividend from the fund are reducing their holding value, which gets reflected in the reduced NAV on the ex-dividend date.


    Arguments Against Dividends

    Some financial analyst believe that the consideration of a dividend policy is irrelevant because investors have the ability to create “homemade” dividends. These analysts claim that income is achieved by investors adjusting their asset allocation in their portfolios.

    For example, investors looking for a steady income stream are more likely to invest in bonds where the interest payments don’t fluctuate, rather than a dividend-paying stock, where the underlying price of the stock can fluctuate. As a result, bond investors don’t care about a particular company’s dividend policy because their interest payments from their bond investments are fixed.

    Another argument against dividends claims that little to no dividend payout is more favorable for investors. Supporters of this policy point out that taxation on a dividend is higher than on a capital gain (In the US). The argument against dividends is based on the belief that a company which reinvests funds (rather than paying them out as dividends) will increase the value of the company in the long-term and, as a result, increase the market value of the stock. According to proponents of this policy, a company’s alternatives to paying out excess cash as dividends are the following: undertaking more projects, repurchasing the company’s own shares, acquiring new companies and profitable assets, and reinvesting in financial assets.

    Arguments for Dividends

    Proponents of dividends point out that a high dividend payout is important for investors because dividends provide certainty about the company’s financial well-being. Typically, companies that have consistently paid dividends are some of the most stable companies over the past several decades. As a result, a company that pays out a dividend attracts investors and creates demand for their stock.

    Dividends are also attractive for investors looking to generate income. However, a decrease or increase in dividend distributions can affect the price of a security. The stock prices of companies that have a long-standing history of dividend payouts would be negatively affected if they reduced their dividend distributions. Conversely, companies that increased their dividend payouts or companies that instituted a new dividend policy would likely see appreciation in their stocks. Investors also see a dividend payment as a sign of a company’s strength and a sign that management has positive expectations for future earnings, which again makes the stock more attractive. A greater demand for a company’s stock will increase its price. Paying dividends sends a clear, powerful message about a company’s future prospects and performance, and its willingness and ability to pay steady dividends over time provides a solid demonstration of financial strength.


    Dividend-Paying Methods:

    Companies that decide to pay a dividend might use one of the three methods outlined below.

    1.     Residual

    Companies using the residual dividend policy choose to rely on internally generated equity to finance any new projects. As a result, dividend payments can come out of the residual or leftover equity only after all project capital requirements are met.

    The benefits to this policy is that it allows a company to use their retained earnings or residual income to invest back into the company, or into other profitable projects before returning funds back to shareholders in the form of dividends.

    As stated earlier, a company’s stock price fluctuates with a rising or falling dividend. If a company’s management team doesn’t believe they can adhere to a strict dividend policy with consistent payouts, it might opt for the residual method. The management team is free to pursue opportunities without being constricted by a dividend policy. However, investors might demand a higher stock price relative to companies in the same industry that have more consistent dividend payouts. Another drawback to the residual method is that it can lead to inconsistent and sporadic dividend payouts resulting in volatility in the company’s stock price.

    2.     Stable

    Under the stable dividend policy, companies consistently pay a dividend each year regardless of earnings fluctuations. The dividend payout amount is typically determined through forecasting long-term earnings and calculating a percentage of earnings to be paid out.

    Under the stable policy, companies may create a target payout ratio, which is a percentage of earnings that is to be paid to shareholders in the long-term.

    The company may choose a cyclical policy that sets dividends at a fixed fraction of quarterly earnings, or it may choose a stable policy whereby quarterly dividends are set at a fraction of yearly earnings. In either case, the aim of the stability policy is to reduce uncertainty for investors and to provide them with income.

    3.    Hybrid

    The final approach combines the residual and stable dividend policies. The hybrid is a popular approach for companies that pay dividends. As companies experience business cycle fluctuations, companies that use the hybrid approach establish a set dividend, which represents a relatively small portion of yearly income and can be easily maintained. In addition to the set dividend, companies can offer an extra dividend paid only when income exceeds certain benchmarks.

    Is Dividend Investing a Good Strategy?

    Investors should be aware of extremely high yields, since there is an inverse relationship between stock price and dividend yield and the distribution might not be sustainable. Stocks that pay dividends typically provide stability to a portfolio, but do not usually outperform high-quality growth stocks.

    It may be counter-intuitive, but as a stock’s price increases, its dividend yield actually decreases. Dividend yield is a ratio of how much cash flow you are getting for each dollar invested in a stock. Many novice investors may incorrectly assume that a higher stock price correlates to a higher dividend yield. Let’s delve into how dividend yield is calculated, so we can grasp this inverse relationship.

    If you own 100 shares of the ABC Corporation, the 100 shares is your basis for dividend distribution. Assume for the moment that ABC Corporation was purchased at $100 per share, which implies a total investment of $10,000. Profits at the ABC Corporation were unusually high, so the board of directors agrees to pay its shareholders $10 per share annually in the form of a cash dividend. So, as an owner of ABC Corporation for a year, your continued investment in ABC Corp result in $1,000 dollars of dividends. The annual yield is the total dividend amount ($1,000) divided by the cost of the stock ($10,000) which equals 10 percent.

    If ABC Corporation was purchased at $200 per share instead, the yield would drop to five percent, since 100 shares now costs $20,000 (or your original $10,000 only gets you 50 shares, instead of 100). As illustrated above, if the price of the stock moves higher, then dividend yield drops and vice versa. From an investment strategy perspective, buying established companies with a history of good dividends adds stability to a portfolio. This is why many investing legends such as John Bogle, Warren Buffet and Benjamin Graham advocate buying stocks that pay dividends as a critical part of the total “investment” return of an asset.


    The Risks to Dividends

    During the 2008-2009 financial crisis, almost all of the major banks either slashed or eliminated their dividend payouts. These companies were known for consistent, stable dividend payouts each quarter for literally hundreds of years. Despite their storied histories, many dividends were cut.

    In other words, dividends are not guaranteed, and are subject to macroeconomic as well as company-specific risks. Another potential downside to investing in dividend-paying stocks is that companies that pay dividends are not usually high-growth leaders. There are some exceptions, but high-growth companies usually do not pay sizable amounts of dividends to its shareholders even if they have significantly outperformed the vast majority of stocks over time. Growth companies tend to spend more dollars on research and development, capital expansion, retaining talented employees and/or mergers and acquisitions. For these companies, all earnings are considered retained earnings, and are reinvested back into the company instead of issuing a dividend to shareholders.

    It is equally important to beware of companies with extraordinarily high yields. As we have learned, if a company’s stock price continues to decline, its yield goes up. Many rookie investors get teased into purchasing a stock just on the basis of a potentially juicy dividend. There is no specific rule of thumb in relation to how much is too much in terms of a dividend payout.

    The average dividend yield on S&P 500 index  companies that pay a dividend historically fluctuates somewhere between 2 and 5 percent, depending on market conditions. In general, it pays to do your homework on stocks yielding more than 8 percent to find out what is truly going on with the company. Doing this due diligence will help you decipher those companies that are truly in financial shambles from those that are temporarily out of favor, and therefore present a good investment value proposition.

    Once a company starts paying dividends, it is highly atypical for it to stop. Dividends are a good way to  give an investment portfolio additional stability, since the periodical cash payments are likely to continue long term. 

    A company must keep growing at an above-average pace to justify reinvesting in itself rather than paying a dividend. Generally speaking, when a company’s growth slows, its stock won’t climb as much, and dividends will be necessary to keep shareholders around. The slowdown of this growth happens to virtually all companies after they attain a large market capitalization. A company will simply reach a size at which it no longer has the potential to grow at annual rates of 30% to 40%, like a small cap, regardless of how much money is plowed back into it. At a certain point, the law of large numbers makes a mega-cap company and growth rates that outperform the market an impossible combination.

    There is another motivation for a company to pay dividends —a steadily increasing dividend payout is viewed as a strong indication of a company’s continuing success. The great thing about dividends is that they can’t be faked; they are either paid or not paid, increased or not increased.

    This isn’t the case with earnings, which are basically an accountant’s best guess of a company’s profitability. All too often, companies must restate their past reported earnings because of aggressive accounting practices, and this can cause considerable trouble for investors, who may have already based future stock price predictions on these unreliable historical earnings. Expected groeth rates are also unreliable

    Since they can be regarded as quasi-bonds, dividend-paying stocks tend to exhibit pricing characteristics that are moderately different from those of growth stocks. This is because they provide regular income that is similar to a bond, but they still provide investors with the potential to benefit from share price appreciation if the company does well.

    Investors looking for exposure to the growth potential of the equity market and the safety of the (moderately) fixed income provided by dividends should consider adding stocks with high dividend yields to their portfolio. A portfolio with dividend-paying stocks is likely to see less price volatility than a growth stock portfolio. 


    Misconceptions About Dividend Stocks

    The biggest misconception of dividend stocks is that a high yield is always a good thing. Many dividend investors simply choose a collection of the highest dividend-paying stock and hope for the best. For a number of reasons, this is not always a good idea. 

    Dividend Stocks are Always Boring. Some of the best traits a dividend stock can have are the announcement of a new dividend, high dividend growth metrics over recent years, or the potential to commit more and raise the dividend (even if the current yield is low). Any of these announcements can jolt the stock price and result in a greater total return. Sure, trying to predict management’s dividends and whether a dividend stock will go up in the future is not easy, but there are several indicators.  If a stock has a low dividend payout ratio but it is generating high levels of free cash flow, it obviously has room to increase its dividend. Earnings growth is one indicator but also keep an eye on cash flow and revenues as well. If a company is growing organically (i.e. increased foot traffic, sales, margins), then it may only be a matter of time before the dividend is increased. However, if a company’s growth is coming from high-risk investments or international expansion then a dividend could be less certain

    Dividend Stocks are Always Safe. Just because a company is producing dividends doesn’t always make it a safe bet. Management can use the dividend to placate frustrated investors when the stock isn’t moving. (In fact, many companies have been known to do this.) Therefore, to avoid dividend traps, it’s always important to at least consider how management is using the dividend in its corporate strategy. Dividends that are consolation prizes to investors for a lack of growth are almost always bad ideas. 

    Compounding Effect

    If dividends are re-invested it can create a compounding effect as show in the graphs below gathered from visualcapitalist.

    Figures retrieved from https://www.visualcapitalist.com/power-dividend-investing/

    Dividend Yield

    The dividend yield, expressed as a percentage, is a financial ratio (dividend/price) that shows how much a company pays out in dividends each year relative to its stock price.

    The dividend yield is an estimate of the dividend-only return of a stock investment. Assuming the dividend is not raised or lowered, the yield will rise when the price of the stock falls. Because dividend yields change relative to the stock price, it can often look unusually high for stocks that are falling in value quickly.

    Figure retrieved from https://en.wikipedia.org/wiki/Dividend_yield

    The dividend yield can be calculated from the last full year’s financial report. This is acceptable during the first few months after the company has released its annual report; however, the longer it has been since the annual report, the less relevant that data is for investors. Alternatively, investors can also add the last four quarters of dividends, which captures the trailing 12 months of dividend data. Using a trailing dividend number is acceptable, but it can make the yield too high or too low if the dividend has recently been cut or raised.

    Because dividends are paid quarterly, many investors will take the last quarterly dividend, multiply it by four, and use the product as the annual dividend for the yield calculation. This approach will reflect any recent changes in the dividend, but not all companies pay an even quarterly dividend. Some firms, especially outside the U.S., pay a small quarterly dividend with a large annual dividend. If the dividend calculation is performed after the large dividend distribution, it will give an inflated yield. Finally, some companies pay a dividend more frequently than quarterly. A monthly dividend could result in a dividend yield calculation that is too low. When deciding how to calculate the dividend yield, an investor should look at the history of dividend payments to decide which method will give the most accurate results.

    Historical evidence suggests that a focus on dividends may amplify returns rather than slow them down. For example, according to analysts at Hartford Funds, since 1970, 78% of the total returns from the S&500 are from dividends. This assumption is based on the fact that investors are likely to reinvest their dividends back into the S&P 500, which then compounds their ability to earn more dividends in the future.

    When comparing measures of corporate dividends,  it’s important to note that the dividend yield tells you what the simple rate of return is in the form of cash dividends to shareholders. However, the dividend payout ratio represents how much of a company’s net earnings are paid out as dividends. While the dividend yield is the more commonly used term, many believe the dividend payout ratio is a better indicator of a company’s ability to distribute dividends consistently in the future. The dividend payout ratio is highly connected to a company’s cash flow.

    The dividend yield shows how much a company has paid out in dividends over the course of a year. The yield is presented as a percentage, not as an actual dollar amount. This makes it easier to see how much return the shareholder can expect to receive per dollar they have invested.

    A forward dividend yield is the percentage of a company’s current stock price that it expects to pay out as dividends over a certain time period, generally 12 months. Forward dividend yields are generally used in circumstances where the yield is predictable based on past instances. If not, trailing yields, which indicate the same value over the previous 12 months, are used.

    Figure retrieved from https://www.visualcapitalist.com/power-dividend-investing/


    A dividend aristocrat is a company that has increased its dividends for at least 25 consecutive years.

    Dividend Payout Ratio

    The dividend payout ratio is the ratio of the total amount of dividends paid out to shareholders relative to the net income of the company. It is the percentage of earnings paid to shareholders in dividends. The amount that is not paid to shareholders is retained by the company to pay off debt or to reinvest in core operations. It is sometimes simply referred to as the ‘payout ratio.’

    The dividend payout ratio provides an indication of how much money a company is returning to shareholders versus how much it is keeping on hand to reinvest in growth, pay off debt, or add to cash reserves (retained earnings). 

    Retrieved from https://www.educba.com/payout-ratio-formula/

    Dividend Payout Ratio=1−Retention Ratio​

    Retention Ratio=(EPS−DPS)/EPS

    Some companies pay out all their earnings to shareholders, while some only pay out a portion of their earnings. If a company pays out some of its earnings as dividends, the remaining portion is retained by the business. To measure the level of earnings retained, the retention ratio is calculated.

    Several considerations go into interpreting the dividend payout ratio, most importantly the company’s level of maturity. A new, growth-oriented company that aims to expand, develop new products, and move into new markets would be expected to reinvest most or all of its earnings and could be forgiven for having a low or even zero payout ratio. The payout ratio is 0% for companies that do not pay dividends and is 100% for companies that pay out their entire net income as dividends.

    The payout ratio is also useful for assessing a dividend’s sustainability. Companies are extremely reluctant to cut dividends since it can drive the stock price down and reflect poorly on management’s abilities. If a company’s payout ratio is over 100%, it is returning more money to shareholders than it is earning and will probably be forced to lower the dividend or stop paying it altogether. That result is not inevitable, however. A company endures a bad year without suspending payouts, and it is often in their interest to do so. It is therefore important to consider future earnings expectations and calculate a forward-looking payout ratio to contextualize the backward-looking one.

    Long-term trends in the payout ratio also matter. A steadily rising ratio could indicate a healthy, maturing business, but a spiking one could mean the dividend is heading into unsustainable territory.

    The retention ratio is a converse concept to the dividend payout ratio. The dividend payout ratio evaluates the percentage of profits earned that a company pays out to its shareholders, while the retention ratio represents the percentage of profits earned that are retained by or reinvested in the company.

    Dividend payouts vary widely by industry, and like most ratios, they are most useful to compare within a given industry

    The augmented payout ratio incorporates share buybacks into the metric; it is calculated by dividing the sum of dividends and buybacks by net income for the same period. If the result is too high, it can indicate an emphasis on short-term boosts to share prices at the expense of reinvestment and long-term growth. Another adjustment that can be made to provide a more accurate picture is to subtract preferred stock dividends for companies that issue preferred shares.

    Dividends Per Share

    Dividends per share (DPS) measures the total amount of profits a company pays out to its shareholders, generally over a year, on a per-share basis. DPS can be calculated by subtracting the special dividends from the sum of all dividends over one year and dividing this figure by the outstanding shares

    Retrieved from https://www.tickertape.in/glossary/dividend-per-share-meaning/

    There are two primary reasons for increases in a company’s dividends per share payout.

    1. The first is simply an increase in the company’s net profits out of which dividends are paid. If the company is performing well and cash flows are improving, there is more room to pay shareholders higher dividends. In this context, a dividend hike is a positive indicator of company performance.
    2. The second reason a company might hike its dividend is because of a shift in the company’s growth strategy, which leads the company to expend less of its cash flow and earnings on growth and expansion, thus leaving a larger share of profits available to be returned to equity investors in the form of dividends.

    Dividend Growth Rate

    Dividend growth calculates the annualized average rate of increase in the dividends paid by a company. Calculating the dividend growth rate is necessary for using a dividend discount model for valuing stocks.  The dividend discount model is a type of security-pricing model. The dividend discount model assumes that the estimated future dividends–discounted by the excess of internal growth over the company’s estimated dividend growth rate–determines a given stock’s price. If the dividend discount model procedure results in a higher number than the current prize of a company’s shares, the model considers the stock undervalued. Investors who use the dividend discount model believe that by estimating the expected value of cash flow in the future, they can find the intrinsic value of a specific stock. A history of strong dividend growth could mean future dividend growth is likely, which can signal long-term profitability.

    Dividend capture strategy

    A dividend capture strategy is a timing-oriented investment strategy involving the timed purchase and subsequent sale of dividend-paying stocks. Dividend capture is specifically calls for buying a stock just prior to the ex-dividend date in order to receive the dividend, then selling it immediately after the dividend is paid.The purpose of the two trades is simply to receive the dividend, as opposed to investing for the longer term. Because markets tend to be somewhat efficient, stocks usually decline in value immediately following ex-dividend, the viability of this strategy has come into question.

    Theoretically, the dividend capture strategy shouldn’t work. If markets operated with perfect logic, then the dividend amount would be exactly reflected in the share price until the ex-dividend date, when the stock price would fall by exactly the dividend amount. Since markets do not operate with such mathematical perfection, it doesn’t usually happen that way. Most often, a trader captures a substantial portion of the dividend despite selling the stock at a slight loss following the ex-dividend date. A typical example would be a stock trading at $20 per share, paying a $1 dividend, falling in price on the ex-date only down to $19.50, which enables a trader to realize a net profit of $0.50, successfully capturing half the dividend in profit.

    Transaction costs further decrease the sum of realized returns. The potential gains from a pure dividend capture strategy are typically small, while possible losses can be considerable if a negative market movement occurs within the holding period.  A drop in stock value on the ex-date which exceeds the amount of the dividend may force the investor to maintain the position for an extended period of time, introducing systematic and company-specific risk into the strategy. Adverse market movements can quickly eliminate any potential gains from this dividend capture approach. In order to minimize these risks, the strategy should be focused on short term holdings of large blue-chip companies. If dividend capture was consistently profitable, computer-driven investment strategies would have already exploited this opportunity.

    Analysis Check

    1. Notable dividend: Is the companies dividend notable compared to the bottom 25% of dividend players in the country’s(eg. Norwegian) market.
    2. High dividend: How does the companies dividend compare to the top 25% of dividend players in the country’s market.
    3. Stable dividend: Have the dividend payments been stable in the past 10 years
    4. Growing dividend: Have the dividend payments grown over the last 10 years.
    5. Dividend coverage: Are the dividend covered by the earnings. Look at payout ratio.
    6. Future dividend coverage: is the dividend forecasted to be covered by earnings in three years? Look at payout ratio.

    Warren Buffet Advice:

    Dividends 101

    What Is a Dividend?

    A dividend is the distribution of some of a company’s earnings to a class of its shareholders, as determined by the company’s board of directors. Common shareholders of dividend-paying companies are typically eligible as long as they own the stock before the ex-dividend date. Dividends may be paid out as cash or in the form of additional stock or other property. Along with companies, various mutual funds and exchange-traded funds (ETF) also pay dividends.

    A dividend is a token reward paid to the shareholders for their investment in a company’s equity, and it usually originates from the company’s net profits. While the major portion of the profits is kept within the company as retained earnings–which represent the money to be used for the company’s ongoing and future business activities–the remainder can be allocated to the shareholders as a dividend. At times, companies may still make dividend payments even when they don’t make suitable profits. They may do so to maintain their established track record of making regular dividend payments.

    The board of directors can choose to issue dividends over various time frames and with different payout rates. Dividends can be paid at a scheduled frequency, such as monthly, quarterly or annually.

    Companies that pay dividends

    Companies can also issue non-recurring special dividends either individually or in addition to a scheduled dividend. Backed by strong business performance and an improved financial outlook,  for instance Microsoft Corp (MSFT) declared a special dividend of $3.00 per share in 2004, which was way above the usual quarterly dividends in the range of $0.08 to $0.16 per share.

    Larger, more established companies with more predictable profits are often the best dividend payers. These companies tend to issue regular dividends because they seek to maximize shareholder wealth in ways aside from normal growth. Companies in the following industry sectors are observed to be maintaining a regular record of dividend payments: Basic materials, Oil and gas, Banks and financial, Healthcare and pharmaceuticals and Utilities. Companies structured as master limited partnership (MLP) and real estate investment trust (REIT) are also top dividend payers since their designations require specified distributions to shareholders.

    Certain dividend-paying companies may go as far as establishing dividend payout targets, which are based on generated profits in a given year. For example, banks typically pay out a certain percentage of their profits in the form of cash dividends. If profits decline, dividend policy can be postponed to better times.

    Start-ups and other high-growth companies, such as those in the technology or biotech sectors, may not offer regular dividends.


    Because these companies may be in the early stages of development and may incur high costs (as well as losses) attributed to research and development, business expansion and operational activities, they may not have sufficient funds to issue dividends. Even profit-making early- to mid-stage companies avoid making dividend payments if they are aiming for higher-than-average growth and expansion, and want to invest their profits back into their business rather than paying dividends. The business growth cycle partially explains why growth firms do not pay dividends; they need these funds to expand their operations, build factories and increase their personnel.

    Important Dividend Dates

    Dividend payments follow a chronological order of events and the associated dates are important to determine the shareholders who qualify for receiving the dividend payment.

    • Announcement Date: Dividends are announced by company management on the announcement date,  and must be approved by the shareholders before they can be paid. Any change in the expected dividend payment can cause the stock to rise or fall quickly as traders adjust to new expectations. The ex-dividend date and record date will occur after the declaration date. Once a dividend is declared on the announcement date, the company has a legal responsibility to pay it.
    • Ex-Dividend Date: The date on which the dividend eligibility expires is called the ex-dividend date or simply the ex-date. For instance, if a stock has an ex-date of Monday, May 5, then shareholders who buy the stock on or after that day will NOT qualify to get the dividend as they are buying it on or after the dividend expiry date. Shareholders who own the stock one business day prior to the ex-date – that is on Friday, May 2, or earlier – will receive the dividend. The value of a share of stock goes down by about the dividend amount when the stock goes ex-dividend.
    • Record Date: The record date is the cut-off date, established by the company in order to determine which shareholders are eligible to receive a dividend or distribution.
    • Payment Date: The company issues the payment of the dividend on the payment date which is when the money gets credited to investors’ accounts.

    The dividend may rise on the announcement approximately by the amount of the dividend declared and then decline by a similar amount at the opening session of the ex-dividend date.

    For example, a company that is trading at $50 per share declares a $5 dividend on the announcement date. As soon as the news becomes public, the share price shoots up by around $5 and hit $55. Say the stock trades at $52 one business day prior to the ex-dividend date. On the ex-dividend date, it comes down by a similar $5 and begins trading at $50 at the start of the trading session on the ex-dividend date, because anyone buying on the ex-dividend date will not receive the dividend.

    Why companies pay dividend

    Companies pay dividends for a variety of reasons. Dividends can be expected by the shareholders as a reward for their trust in a company. The company management may aim to honor this sentiment by delivering a robust track record of dividend payments. Dividend payments reflect positively on a company and help maintain investors’ trust.


    A high-value dividend declaration can indicate that the company is doing well and has generated good profits. But it can also indicate that the company does not have suitable projects to generate better returns in the future. Therefore, it is utilizing its cash to pay shareholders instead of reinvesting it into growth

    One of the simplest ways for companies to foster goodwill among their shareholders, drive demand for the stock, and communicate financial well-being and shareholder value is through paying dividends. Paying dividends sends a message about a company’s future prospects and performance. Its willingness and ability to pay steady dividends over time provides a solid demonstration of financial strength. Mature firms that believe they can increase value by reinvesting their earnings will choose not to pay dividends.

    If a company has a long history of dividend payments, a reduction of the dividend amount, or its elimination, may signal to investors that the company is in trouble. The announcement of a 50% decrease in dividends from General Electric Co. (GE), one of the biggest American industrial companies, was accompanied by a decline of more than six percent in GE’s stock price on November 13, 2017.

    A reduction in dividend amount or a decision against making any dividend payment may not necessarily translate into bad news about a company. It may be possible that the company’s management has better plans for investing the money, given its financials and operations. For example, a company’s management may choose to invest in a high-return project that has the potential to magnify returns for shareholders in the long run, as compared to the petty gains they will realize through dividend payments.

    It could be when the pricing and conditions are just right for a stock buyback; weathering a major recession becomes the priority; or a company needs to accumulate cash on hand for a big merger or acquisition. 

    Forms of dividend

    A cash dividend is a payment doled out by a company to its stockholders in the form of periodic distributions of cash. Most brokers offer a choice to accept or reinvest cash dividends; reinvesting dividends is often a smart choice for investors with a long-term focus.

    A stock dividend is a dividend payment to shareholders that is made in shares rather than as cash. The stock dividend has the advantage of rewarding shareholders without reducing the company’s cash balance, although it can dilute earnings per share. This type of dividend may be made when a company wants to reward its investors but doesn’t have the spare cash or wants to preserve its cash for other investments. This, however, like the cash dividend, does not increase the value of the company. If the company was priced at $10 per share, the value of the company would be $10 million. After the stock dividend, the value will remain the same, but the share price will decrease to $9.52 to adjust for the dividend payout.

    Stock dividends can have a negative impact on share price in the short-term. Because it increases the number of shares outstanding while the value of the company remains stable, it dilutes the book value per common share, and the stock price is reduced accordingly.

    Fund Dividends v. Company dividends

    Dividends paid by funds are different from dividends paid by companies. Company dividends are usually paid from profits that are generated from the company’s business operations. Funds work on the principle of net asset value (NAV), which reflects the valuation of their holdings or the price of the asset(s) that a fund may be tracking. Since funds don’t have any intrinsic profits, they pay dividends sourced from their NAV.

    Due to the NAV-based working of funds, regular and high-frequency dividend payments should not be misunderstood as a stellar performance by the fund. For example, a bond-investing fund may pay monthly dividends as it receives money in the form of monthly interest on its interest-bearing holdings. The fund is merely transferring the income from the interest fully or partially to the fund investors. A stock-investing fund may also pay dividends. Its dividends may come from the dividend(s) it receives from the stocks held in its portfolio, or by selling a certain quantity of stocks. It’s likely the investors receiving the dividend from the fund are reducing their holding value, which gets reflected in the reduced NAV on the ex-dividend date.


    Arguments Against Dividends

    Some financial analyst believe that the consideration of a dividend policy is irrelevant because investors have the ability to create “homemade” dividends. These analysts claim that income is achieved by investors adjusting their asset allocation in their portfolios.

    For example, investors looking for a steady income stream are more likely to invest in bonds where the interest payments don’t fluctuate, rather than a dividend-paying stock, where the underlying price of the stock can fluctuate. As a result, bond investors don’t care about a particular company’s dividend policy because their interest payments from their bond investments are fixed.

    Another argument against dividends claims that little to no dividend payout is more favorable for investors. Supporters of this policy point out that taxation on a dividend is higher than on a capital gain (In the US). The argument against dividends is based on the belief that a company which reinvests funds (rather than paying them out as dividends) will increase the value of the company in the long-term and, as a result, increase the market value of the stock. According to proponents of this policy, a company’s alternatives to paying out excess cash as dividends are the following: undertaking more projects, repurchasing the company’s own shares, acquiring new companies and profitable assets, and reinvesting in financial assets.

    Arguments for Dividends

    Proponents of dividends point out that a high dividend payout is important for investors because dividends provide certainty about the company’s financial well-being. Typically, companies that have consistently paid dividends are some of the most stable companies over the past several decades. As a result, a company that pays out a dividend attracts investors and creates demand for their stock.

    Dividends are also attractive for investors looking to generate income. However, a decrease or increase in dividend distributions can affect the price of a security. The stock prices of companies that have a long-standing history of dividend payouts would be negatively affected if they reduced their dividend distributions. Conversely, companies that increased their dividend payouts or companies that instituted a new dividend policy would likely see appreciation in their stocks. Investors also see a dividend payment as a sign of a company’s strength and a sign that management has positive expectations for future earnings, which again makes the stock more attractive. A greater demand for a company’s stock will increase its price. Paying dividends sends a clear, powerful message about a company’s future prospects and performance, and its willingness and ability to pay steady dividends over time provides a solid demonstration of financial strength.


    Dividend-Paying Methods:

    Companies that decide to pay a dividend might use one of the three methods outlined below.

    1.     Residual

    Companies using the residual dividend policy choose to rely on internally generated equity to finance any new projects. As a result, dividend payments can come out of the residual or leftover equity only after all project capital requirements are met.

    The benefits to this policy is that it allows a company to use their retained earnings or residual income to invest back into the company, or into other profitable projects before returning funds back to shareholders in the form of dividends.

    As stated earlier, a company’s stock price fluctuates with a rising or falling dividend. If a company’s management team doesn’t believe they can adhere to a strict dividend policy with consistent payouts, it might opt for the residual method. The management team is free to pursue opportunities without being constricted by a dividend policy. However, investors might demand a higher stock price relative to companies in the same industry that have more consistent dividend payouts. Another drawback to the residual method is that it can lead to inconsistent and sporadic dividend payouts resulting in volatility in the company’s stock price.

    2.     Stable

    Under the stable dividend policy, companies consistently pay a dividend each year regardless of earnings fluctuations. The dividend payout amount is typically determined through forecasting long-term earnings and calculating a percentage of earnings to be paid out.

    Under the stable policy, companies may create a target payout ratio, which is a percentage of earnings that is to be paid to shareholders in the long-term.

    The company may choose a cyclical policy that sets dividends at a fixed fraction of quarterly earnings, or it may choose a stable policy whereby quarterly dividends are set at a fraction of yearly earnings. In either case, the aim of the stability policy is to reduce uncertainty for investors and to provide them with income.

    3.    Hybrid

    The final approach combines the residual and stable dividend policies. The hybrid is a popular approach for companies that pay dividends. As companies experience business cycle fluctuations, companies that use the hybrid approach establish a set dividend, which represents a relatively small portion of yearly income and can be easily maintained. In addition to the set dividend, companies can offer an extra dividend paid only when income exceeds certain benchmarks.

    Is Dividend Investing a Good Strategy?

    Investors should be aware of extremely high yields, since there is an inverse relationship between stock price and dividend yield and the distribution might not be sustainable. Stocks that pay dividends typically provide stability to a portfolio, but do not usually outperform high-quality growth stocks.

    It may be counter-intuitive, but as a stock’s price increases, its dividend yield actually decreases. Dividend yield is a ratio of how much cash flow you are getting for each dollar invested in a stock. Many novice investors may incorrectly assume that a higher stock price correlates to a higher dividend yield. Let’s delve into how dividend yield is calculated, so we can grasp this inverse relationship.

    If you own 100 shares of the ABC Corporation, the 100 shares is your basis for dividend distribution. Assume for the moment that ABC Corporation was purchased at $100 per share, which implies a total investment of $10,000. Profits at the ABC Corporation were unusually high, so the board of directors agrees to pay its shareholders $10 per share annually in the form of a cash dividend. So, as an owner of ABC Corporation for a year, your continued investment in ABC Corp result in $1,000 dollars of dividends. The annual yield is the total dividend amount ($1,000) divided by the cost of the stock ($10,000) which equals 10 percent.

    If ABC Corporation was purchased at $200 per share instead, the yield would drop to five percent, since 100 shares now costs $20,000 (or your original $10,000 only gets you 50 shares, instead of 100). As illustrated above, if the price of the stock moves higher, then dividend yield drops and vice versa. From an investment strategy perspective, buying established companies with a history of good dividends adds stability to a portfolio. This is why many investing legends such as John Bogle, Warren Buffet and Benjamin Graham advocate buying stocks that pay dividends as a critical part of the total “investment” return of an asset.


    The Risks to Dividends

    During the 2008-2009 financial crisis, almost all of the major banks either slashed or eliminated their dividend payouts. These companies were known for consistent, stable dividend payouts each quarter for literally hundreds of years. Despite their storied histories, many dividends were cut.

    In other words, dividends are not guaranteed, and are subject to macroeconomic as well as company-specific risks. Another potential downside to investing in dividend-paying stocks is that companies that pay dividends are not usually high-growth leaders. There are some exceptions, but high-growth companies usually do not pay sizable amounts of dividends to its shareholders even if they have significantly outperformed the vast majority of stocks over time. Growth companies tend to spend more dollars on research and development, capital expansion, retaining talented employees and/or mergers and acquisitions. For these companies, all earnings are considered retained earnings, and are reinvested back into the company instead of issuing a dividend to shareholders.

    It is equally important to beware of companies with extraordinarily high yields. As we have learned, if a company’s stock price continues to decline, its yield goes up. Many rookie investors get teased into purchasing a stock just on the basis of a potentially juicy dividend. There is no specific rule of thumb in relation to how much is too much in terms of a dividend payout.

    The average dividend yield on S&P 500 index  companies that pay a dividend historically fluctuates somewhere between 2 and 5 percent, depending on market conditions. In general, it pays to do your homework on stocks yielding more than 8 percent to find out what is truly going on with the company. Doing this due diligence will help you decipher those companies that are truly in financial shambles from those that are temporarily out of favor, and therefore present a good investment value proposition.

    Once a company starts paying dividends, it is highly atypical for it to stop. Dividends are a good way to  give an investment portfolio additional stability, since the periodical cash payments are likely to continue long term. 

    A company must keep growing at an above-average pace to justify reinvesting in itself rather than paying a dividend. Generally speaking, when a company’s growth slows, its stock won’t climb as much, and dividends will be necessary to keep shareholders around. The slowdown of this growth happens to virtually all companies after they attain a large market capitalization. A company will simply reach a size at which it no longer has the potential to grow at annual rates of 30% to 40%, like a small cap, regardless of how much money is plowed back into it. At a certain point, the law of large numbers makes a mega-cap company and growth rates that outperform the market an impossible combination.

    There is another motivation for a company to pay dividends —a steadily increasing dividend payout is viewed as a strong indication of a company’s continuing success. The great thing about dividends is that they can’t be faked; they are either paid or not paid, increased or not increased.

    This isn’t the case with earnings, which are basically an accountant’s best guess of a company’s profitability. All too often, companies must restate their past reported earnings because of aggressive accounting practices, and this can cause considerable trouble for investors, who may have already based future stock price predictions on these unreliable historical earnings. Expected groeth rates are also unreliable

    Since they can be regarded as quasi-bonds, dividend-paying stocks tend to exhibit pricing characteristics that are moderately different from those of growth stocks. This is because they provide regular income that is similar to a bond, but they still provide investors with the potential to benefit from share price appreciation if the company does well.

    Investors looking for exposure to the growth potential of the equity market and the safety of the (moderately) fixed income provided by dividends should consider adding stocks with high dividend yields to their portfolio. A portfolio with dividend-paying stocks is likely to see less price volatility than a growth stock portfolio. 


    Misconceptions About Dividend Stocks

    The biggest misconception of dividend stocks is that a high yield is always a good thing. Many dividend investors simply choose a collection of the highest dividend-paying stock and hope for the best. For a number of reasons, this is not always a good idea. 

    Dividend Stocks are Always Boring. Some of the best traits a dividend stock can have are the announcement of a new dividend, high dividend growth metrics over recent years, or the potential to commit more and raise the dividend (even if the current yield is low). Any of these announcements can jolt the stock price and result in a greater total return. Sure, trying to predict management’s dividends and whether a dividend stock will go up in the future is not easy, but there are several indicators.  If a stock has a low dividend payout ratio but it is generating high levels of free cash flow, it obviously has room to increase its dividend. Earnings growth is one indicator but also keep an eye on cash flow and revenues as well. If a company is growing organically (i.e. increased foot traffic, sales, margins), then it may only be a matter of time before the dividend is increased. However, if a company’s growth is coming from high-risk investments or international expansion then a dividend could be less certain

    Dividend Stocks are Always Safe. Just because a company is producing dividends doesn’t always make it a safe bet. Management can use the dividend to placate frustrated investors when the stock isn’t moving. (In fact, many companies have been known to do this.) Therefore, to avoid dividend traps, it’s always important to at least consider how management is using the dividend in its corporate strategy. Dividends that are consolation prizes to investors for a lack of growth are almost always bad ideas. 

    Compounding Effect

    If dividends are re-invested it can create a compounding effect as show in the graphs below gathered from visualcapitalist.

    Figures retrieved from https://www.visualcapitalist.com/power-dividend-investing/

    Dividend Yield

    The dividend yield, expressed as a percentage, is a financial ratio (dividend/price) that shows how much a company pays out in dividends each year relative to its stock price.

    The dividend yield is an estimate of the dividend-only return of a stock investment. Assuming the dividend is not raised or lowered, the yield will rise when the price of the stock falls. Because dividend yields change relative to the stock price, it can often look unusually high for stocks that are falling in value quickly.

    Figure retrieved from https://en.wikipedia.org/wiki/Dividend_yield

    The dividend yield can be calculated from the last full year’s financial report. This is acceptable during the first few months after the company has released its annual report; however, the longer it has been since the annual report, the less relevant that data is for investors. Alternatively, investors can also add the last four quarters of dividends, which captures the trailing 12 months of dividend data. Using a trailing dividend number is acceptable, but it can make the yield too high or too low if the dividend has recently been cut or raised.

    Because dividends are paid quarterly, many investors will take the last quarterly dividend, multiply it by four, and use the product as the annual dividend for the yield calculation. This approach will reflect any recent changes in the dividend, but not all companies pay an even quarterly dividend. Some firms, especially outside the U.S., pay a small quarterly dividend with a large annual dividend. If the dividend calculation is performed after the large dividend distribution, it will give an inflated yield. Finally, some companies pay a dividend more frequently than quarterly. A monthly dividend could result in a dividend yield calculation that is too low. When deciding how to calculate the dividend yield, an investor should look at the history of dividend payments to decide which method will give the most accurate results.

    Historical evidence suggests that a focus on dividends may amplify returns rather than slow them down. For example, according to analysts at Hartford Funds, since 1970, 78% of the total returns from the S&500 are from dividends. This assumption is based on the fact that investors are likely to reinvest their dividends back into the S&P 500, which then compounds their ability to earn more dividends in the future.

    When comparing measures of corporate dividends,  it’s important to note that the dividend yield tells you what the simple rate of return is in the form of cash dividends to shareholders. However, the dividend payout ratio represents how much of a company’s net earnings are paid out as dividends. While the dividend yield is the more commonly used term, many believe the dividend payout ratio is a better indicator of a company’s ability to distribute dividends consistently in the future. The dividend payout ratio is highly connected to a company’s cash flow.

    The dividend yield shows how much a company has paid out in dividends over the course of a year. The yield is presented as a percentage, not as an actual dollar amount. This makes it easier to see how much return the shareholder can expect to receive per dollar they have invested.

    A forward dividend yield is the percentage of a company’s current stock price that it expects to pay out as dividends over a certain time period, generally 12 months. Forward dividend yields are generally used in circumstances where the yield is predictable based on past instances. If not, trailing yields, which indicate the same value over the previous 12 months, are used.

    Figure retrieved from https://www.visualcapitalist.com/power-dividend-investing/


    A dividend aristocrat is a company that has increased its dividends for at least 25 consecutive years.

    Dividend Payout Ratio

    The dividend payout ratio is the ratio of the total amount of dividends paid out to shareholders relative to the net income of the company. It is the percentage of earnings paid to shareholders in dividends. The amount that is not paid to shareholders is retained by the company to pay off debt or to reinvest in core operations. It is sometimes simply referred to as the ‘payout ratio.’

    The dividend payout ratio provides an indication of how much money a company is returning to shareholders versus how much it is keeping on hand to reinvest in growth, pay off debt, or add to cash reserves (retained earnings). 

    Retrieved from https://www.educba.com/payout-ratio-formula/

    Dividend Payout Ratio=1−Retention Ratio​

    Retention Ratio=(EPS−DPS)/EPS

    Some companies pay out all their earnings to shareholders, while some only pay out a portion of their earnings. If a company pays out some of its earnings as dividends, the remaining portion is retained by the business. To measure the level of earnings retained, the retention ratio is calculated.

    Several considerations go into interpreting the dividend payout ratio, most importantly the company’s level of maturity. A new, growth-oriented company that aims to expand, develop new products, and move into new markets would be expected to reinvest most or all of its earnings and could be forgiven for having a low or even zero payout ratio. The payout ratio is 0% for companies that do not pay dividends and is 100% for companies that pay out their entire net income as dividends.

    The payout ratio is also useful for assessing a dividend’s sustainability. Companies are extremely reluctant to cut dividends since it can drive the stock price down and reflect poorly on management’s abilities. If a company’s payout ratio is over 100%, it is returning more money to shareholders than it is earning and will probably be forced to lower the dividend or stop paying it altogether. That result is not inevitable, however. A company endures a bad year without suspending payouts, and it is often in their interest to do so. It is therefore important to consider future earnings expectations and calculate a forward-looking payout ratio to contextualize the backward-looking one.

    Long-term trends in the payout ratio also matter. A steadily rising ratio could indicate a healthy, maturing business, but a spiking one could mean the dividend is heading into unsustainable territory.

    The retention ratio is a converse concept to the dividend payout ratio. The dividend payout ratio evaluates the percentage of profits earned that a company pays out to its shareholders, while the retention ratio represents the percentage of profits earned that are retained by or reinvested in the company.

    Dividend payouts vary widely by industry, and like most ratios, they are most useful to compare within a given industry

    The augmented payout ratio incorporates share buybacks into the metric; it is calculated by dividing the sum of dividends and buybacks by net income for the same period. If the result is too high, it can indicate an emphasis on short-term boosts to share prices at the expense of reinvestment and long-term growth. Another adjustment that can be made to provide a more accurate picture is to subtract preferred stock dividends for companies that issue preferred shares.

    Dividends Per Share

    Dividends per share (DPS) measures the total amount of profits a company pays out to its shareholders, generally over a year, on a per-share basis. DPS can be calculated by subtracting the special dividends from the sum of all dividends over one year and dividing this figure by the outstanding shares

    Retrieved from https://www.tickertape.in/glossary/dividend-per-share-meaning/

    There are two primary reasons for increases in a company’s dividends per share payout.

    1. The first is simply an increase in the company’s net profits out of which dividends are paid. If the company is performing well and cash flows are improving, there is more room to pay shareholders higher dividends. In this context, a dividend hike is a positive indicator of company performance.
    2. The second reason a company might hike its dividend is because of a shift in the company’s growth strategy, which leads the company to expend less of its cash flow and earnings on growth and expansion, thus leaving a larger share of profits available to be returned to equity investors in the form of dividends.

    Dividend Growth Rate

    Dividend growth calculates the annualized average rate of increase in the dividends paid by a company. Calculating the dividend growth rate is necessary for using a dividend discount model for valuing stocks.  The dividend discount model is a type of security-pricing model. The dividend discount model assumes that the estimated future dividends–discounted by the excess of internal growth over the company’s estimated dividend growth rate–determines a given stock’s price. If the dividend discount model procedure results in a higher number than the current prize of a company’s shares, the model considers the stock undervalued. Investors who use the dividend discount model believe that by estimating the expected value of cash flow in the future, they can find the intrinsic value of a specific stock. A history of strong dividend growth could mean future dividend growth is likely, which can signal long-term profitability.

    Dividend capture strategy

    A dividend capture strategy is a timing-oriented investment strategy involving the timed purchase and subsequent sale of dividend-paying stocks. Dividend capture is specifically calls for buying a stock just prior to the ex-dividend date in order to receive the dividend, then selling it immediately after the dividend is paid.The purpose of the two trades is simply to receive the dividend, as opposed to investing for the longer term. Because markets tend to be somewhat efficient, stocks usually decline in value immediately following ex-dividend, the viability of this strategy has come into question.

    Theoretically, the dividend capture strategy shouldn’t work. If markets operated with perfect logic, then the dividend amount would be exactly reflected in the share price until the ex-dividend date, when the stock price would fall by exactly the dividend amount. Since markets do not operate with such mathematical perfection, it doesn’t usually happen that way. Most often, a trader captures a substantial portion of the dividend despite selling the stock at a slight loss following the ex-dividend date. A typical example would be a stock trading at $20 per share, paying a $1 dividend, falling in price on the ex-date only down to $19.50, which enables a trader to realize a net profit of $0.50, successfully capturing half the dividend in profit.

    Transaction costs further decrease the sum of realized returns. The potential gains from a pure dividend capture strategy are typically small, while possible losses can be considerable if a negative market movement occurs within the holding period.  A drop in stock value on the ex-date which exceeds the amount of the dividend may force the investor to maintain the position for an extended period of time, introducing systematic and company-specific risk into the strategy. Adverse market movements can quickly eliminate any potential gains from this dividend capture approach. In order to minimize these risks, the strategy should be focused on short term holdings of large blue-chip companies. If dividend capture was consistently profitable, computer-driven investment strategies would have already exploited this opportunity.

    Analysis Check

    1. Notable dividend: Is the companies dividend notable compared to the bottom 25% of dividend players in the country’s(eg. Norwegian) market.
    2. High dividend: How does the companies dividend compare to the top 25% of dividend players in the country’s market.
    3. Stable dividend: Have the dividend payments been stable in the past 10 years
    4. Growing dividend: Have the dividend payments grown over the last 10 years.
    5. Dividend coverage: Are the dividend covered by the earnings. Look at payout ratio.
    6. Future dividend coverage: is the dividend forecasted to be covered by earnings in three years? Look at payout ratio.

    Warren Buffet Advice:

    Intro to Bonds: A guide

    A bond is a fixed income instrument that represent a loan made by an investor to a borrower (typically corporate or government).  Bonds are used by companies, municipalities, states, and sovereign governments to finance projects and operations. Owners of bonds are debtholders, or creditors, of the issuer. A bond is referred to as a fixed income instrument since bonds traditionally paid a fixed interest rate (coupon) to debtholders. Variable or floating interest rates are also now quite common. Bond prices are inversely correlated with interest rates: when rates go up, bond prices fall and vice-versa. Bonds have maturity dates at which point the principal amount must be paid back in full or risk default.

    Governments and corporations commonly use bonds in order to borrow money. Governments need to fund roads, schools, dams or other infrastructure. The sudden expense of war may also demand the need to raise funds. Similarly, corporations will often borrow to grow their business, to buy property and equipment, to undertake profitable projects, for research and development or to hire employees. Large organizations often need more money than the average bank can provide, and bonds can be the solution by allowing many individual investors to assume the role of the lender. Moreover, markets allow lenders to sell their bonds to other investors or to buy bonds from other individuals—long after the original issuing organization raised capital.

    Illustration 1: An original Bond Issue

    The borrower (issuer) issues a bond that includes the terms of the loan, interest payments that will be made, and the time at which the loaned funds (bond principal) must be paid back (maturity date). The interest payment (the coupon) is part of the return that bondholders earn for loaning their funds to the issuer. The interest rate that determines the payment is called the coupon rate.

    The initial price of most bonds is typically set at par, usually $100 or $1,000 face value per individual bond. The actual market price of a bond depends on a number of factors: the credit quality of the issuer, the length of time until expiration, and the coupon rate compared to the general interest rate environment at the time. The face value of the bond is what will be paid back to the borrower once the bond matures.

    Most bonds can be sold by the initial bondholder to other investors after they have been issued. It is also common for bonds to be repurchased by the borrower if interest rates decline, or if the borrower’s credit has improved, and it can reissue new bonds at a lower cost.

    Characteristics of Bonds

    • Face value is the money amount the bond will be worth at maturity; it is also the reference amount the bond issuer uses when calculating interest payments. For example, say an investor purchases a bond at a premium $1,090 and another investor buys the same bond later when it is trading at a discount for $980. When the bond matures, both investors will receive the $1,000 face value of the bond.
    • The coupon rate is the rate of interest the bond issuer will pay on the face value of the bond, expressed as a percentage. For example, a 5% coupon rate means that bondholders will receive 5% x $1000 face value = $50 every year. Two features of a bond—credit quality and time to maturity—are the principal determinants of a bond’s coupon rate. If the issuer has a poor credit rating, the risk of default is greater, and these bonds pay more interest. Bonds that have a very long maturity date also usually pay a higher interest rate. This higher compensation is because the bondholder is more exposed to interest rate and inflation risks for an extended period. Credit ratings for a company and its bonds are generated by credit rating agencies like Standard and Poor’s, Moody’s, and Fitch ratings.. The very highest quality bonds are called ‘investment grade’ and include debt issued by the U.S. government and very stable companies, like many utilities. Bonds that are not considered investment grade, but are not in default, are called ‘high yield” or “junk” bonds. These bonds have a higher risk of default in the future and investors demand a higher coupon payment to compensate them for that risk.
    • Coupon dates are the dates on which the bond issuer will make interest payments. Payments can be made in any interval, but the standard is semiannual payments.
    • The maturity date is the date on which the bond will mature and the bond issuer will pay the bondholder the face value of the bond.
    • The issue price is the price at which the bond issuer originally sells the bonds.

    Bonds and bond portfolios will rise or fall in value as interest rates change. The sensitivity to changes in the interest rate environment is called “duration”. The use of the term duration in this context can be confusing to new bond investors because it does not refer to the length of time the bond has before maturity. Instead, duration describes how much a bond’s price will rise or fall with a change in interest rates.

    Categories of Bonds:

    Corporate bonds are issued by companies. Companies issue bonds rather than seek bank loans for debt financing in many cases because bond markets offer more favorable terms and lower interest rates.

    Illustration 2: Bond issued by the Dutch East India Company in 1623

    Municipal bonds are issued by states and municipalities. Some municipal bonds offer tax-free coupon income for investors.

    Government bonds such as those issued by the U.S. Treasury. Bonds issued by the Treasury with a year or less to maturity are called “Bills”; bonds issued with 1–10 years to maturity are called “notes”; and bonds issued with more than 10 years to maturity are called “bonds”. The entire category of bonds issued by a government treasury is often collectively referred to as “treasuries.” Government bonds issued by national governments may be referred to as sovereign debt.

    Agency bonds are those issued by government-affiliated organizations such as Fannie Mae or Freddie Mac.

    Varieties of Bonds

    Zero-coupon bonds do not pay coupon payments and instead are issued at a discount to their par value that will generate a return once the bondholder is paid the full face value when the bond matures. U.S. Treasury bills are a zero-coupon bond.

    Convertible bonds are debt instruments with an embedded option that allows bondholders to convert their debt into stock at some point, depending on certain conditions like the share price. For example, imagine a company that needs to borrow $1 million to fund a new project. They could borrow by issuing bonds with a 12% coupon that matures in 10 years. However, if they knew that there were some investors willing to buy bonds with an 8% coupon that allowed them to convert the bond into stock if the stock’s price rose above a certain value, they might prefer to issue those. The convertible bond may the best solution for the company because they would have lower interest payments while the project was in its early stages. If the investors converted their bonds, the other shareholders would be diluted, but the company would not have to pay any more interest or the principal of the bond. The investors who purchased a convertible bond may think this is a great solution because they can profit from the upside in the stock if the project is successful. They are taking more risk by accepting a lower coupon payment, but the potential reward if the bonds are converted could make that trade-off acceptable.

    Callable bonds also have an embedded option but it is different than what is found in a convertible bond. A callable bond is one that can be “called” back by the company before it matures. Assume that a company has borrowed $1 million by issuing bonds with a 10% coupon that mature in 10 years. If interest rates decline (or the company’s credit rating improves) in year 5 when the company could borrow for 8%, they will call or buy the bonds back from the bondholders for the principal amount and reissue new bonds at a lower coupon rate. A callable bond is riskier for the bond buyer because the bond is more likely to be called when it is rising in value. Remember, when interest rates are falling, bond prices rise. Because of this, callable bonds are not as valuable as bonds that aren’t callable with the same maturity, credit rating, and coupon rate.

    Illustration 3: A Swedish bond from 1955.

    Puttable bond allows the bondholders to put or sell the bond back to the company before it has matured. This is valuable for investors who are worried that a bond may fall in value, or if they think interest rates will rise and they want to get their principal back before the bond falls in value. The bond issuer may include a put option in the bond that benefits the bondholders in return for a lower coupon rate or just to induce the bond sellers to make the initial loan. A puttable bond usually trades at a higher value than a bond without a put option but with the same credit rating, maturity, and coupon rate because it is more valuable to the bondholders.

    The possible combinations of embedded puts, calls, and convertibility rights in a bond are endless and each one is unique. There isn’t a strict standard for each of these rights and some bonds will contain more than one kind of “option” which can make comparisons difficult. Generally, individual investors rely on bond professionals to select individual bonds or bond funds that meet their investing goals.

    Pricing Bonds

    The market prices bonds based on their particular characteristics. A bond’s price changes on a daily basis. But there is a logic to how bonds are valued. Bonds do not have to be held to maturity. At any time, a bondholder can sell their bonds in the open market, where the price can fluctuate, sometimes dramatically.

    The price of a bond changes in response to changes in interest rates in the economy. This is due to the fact that for a fixed-rate bond the issuer has promised to pay a coupon based on the face value of the bond—so for a $1,000 par, 10% annual coupon bond, the issuer will pay the bondholder $100 each year. Say that prevailing interest rates are also 10% at the time that this bond is issued, as determined by the rate on a short-term government bond. An investor would be indifferent investing in the corporate bond or the government bond since both would return $100. However, imagine a little while later, that the economy has taken a turn for the worse and interest rates dropped to 5%. Now, the investor can only receive $50 from the government bond, but would still receive $100 from the corporate bond.

    This difference makes the corporate bond much more attractive. So, investors in the market will bid up to the price of the bond until it trades at a premium that equalizes the prevailing interest rate environment—in this case, the bond will trade at a price of $2,000 so that the $100 coupon represents 5%. Likewise, if interest rates soared to 15%, then an investor could make $150 from the government bond and would not pay $1,000 to earn just $100. This bond would be sold until it reached a price that equalized the yields, in this case to a price of $666.67.

    Illustration 4: Railroad obligation of the Moscow-Kiev-Voronezh railroad company, printed in Russian, Dutch and German.

    Inverse to Interest Rates

    This is why the famous statement that a bond’s price varies inversely with interest rates works. When interest rates go up, bond prices fall in order to have the effect of equalizing the interest rate on the bond with prevailing rates, and vice versa.

    Another way of illustrating this concept is to consider what the yield on our bond would be given a price change, instead of given an interest rate change. For example, if the price were to go down from $1,000 to $800, then the yield goes up to 12.5%. This happens because you are getting the same guaranteed $100 on an asset that is worth $800 ($100/$800). Conversely, if the bond goes up in price to $1,200, the yield shrinks to 8.33% ($100/$1,200).

    Bond Risk

    Bonds are relatively safe investments, but just like any other investment they do come with a risk.

    Interest Rate Risk: Interest rates share an inverse relationship with bonds, so when rates rise, bonds tend to fall and vice versa. Interest rate risk comes when rates change significantly from what the investor expected. If interest rates decline significantly, the investor faces the possibility of prepayment. If interest rates rise, the investor will be stuck with an instrument yielding below market rates. The greater the time to maturity, the greater the risk.

    Credit or default risk is the risk that interest and principal payments due on the obligation will not be made as required. When an investor buys a bond, they expect that the issuer will make good on the interest and principal payments—just like any other creditor. When an investor looks into corporate bonds, they should weigh out the possibility that the company may default on the debt. Safety usually means the company has greater operating income and cash flow compared to its debt. If the inverse is true and the debt outweighs available cash, the investor may want to stay away.

    Illustration 6: Bond certificate for the state of South Carolina issued in 1873 under the state’s Consolidation Act.

    Prepayment risk is the risk that a given bond issue will be paid off earlier than expected, normally through a call provision.  This can be bad news for investors because the company only has an incentive to repay the obligation early when interest rates have declined substantially. Instead of continuing to hold a high-interest investment, investors are left to reinvest funds in a lower interest rate environment.

    Reinvestment risk, a bond poses a reinvestment risk to investors if the proceeds from the bond or future cash flows will need to be reinvested in a security with a lower yield than the bond originally provided. Reinvestment risk can also come with callable bonds—investments that can be called by the issuer before the maturity rate.

    For example, imagine an investor buys a $1,000 bond with an annual coupon of 12%. Each year, the investor receives $120 (12% x $1,000), which can be reinvested back into another bond. But imagine that, over time, the market rate falls to 1%. Suddenly, that $120 received from the bond can only be reinvested at 1%, instead of the 12% rate of the original bond.

    Another risk is that a bond will be called by its issuer. Callable bonds have call provision that allow the bond issuer to purchase the bond back from the bondholders and retire the issue. This is usually done when interest rate fall substantially since the issue date. Call provisions allow the issuer to retire the old, high-rate bonds and sell low-rate bonds in a bid to lower debt costs.

    Default risk occurs when the bond’s issuer is unable to pay the contractual interest or principal on the bond in a timely manner or at all. Credit rating services give credit ratings to bond issues.  For example, most federal governments have very high credit ratings (AAA). However, small emerging companies have some of the worst credit—BB and lower—and are more likely to default on their bond payments. In these cases, bondholders will likely lose all or most of their investments.

    Inflation Risk- This risk refers to situations when the rate of price increases in the economy deteriorates the returns associated with the bond. This has the greatest effect on fixed bonds, which have a set interest rate from inception.

    How to buy a bond

    Bond Broker- Many specialized bond brokerages require high minimum initial deposits; $5,000 is typical. There may also be account maintenance fees. And of course, commissions on trades. Depending on the quantity and type of bond purchased, broker commissions can range from 0.5% to 2%. When using a broker (even your regular one) to purchase bonds, you may be told that the trade is free of commison. What often happens, however, is that the price is marked up so that the cost you are charged essentially includes a compensatory fee. If the broker isn’t earning anything off of the transaction, he or she probably would not offer the service. For example, say you placed an order for 10 corporate bonds that were trading at $1,025 per bond. You’d be told, though, that they cost $1,035.25 per bond, so the total price of your investment comes not to $10,250 but to $10,352.50. The difference represents an effective 1% commission for the broker. To determine the markup before purchase, look up the latest quote for the bond; you can also use the TRACE, which shows all over-the-counter (OTC) transactions for the secondary bond market. Use your discretion to decide whether or not the commission fee is excessive or one you are willing to accept.

    Buying Government Bonds-Purchasing government bonds such as Treasuries (U.S.) or Canada Savings Bonds (Canada) works slightly differently than buying corporate or municipal bonds. Many financial institutions provide services to their clients that allow them to purchase government bonds through their regular investment accounts. If this service is not available to you through your bank or brokerage, you also have the option to purchase these securities directly from the government.

    Illustration 7: A USA Bond issuance

    Bond Funds- Another way to gain exposure in bonds would be to invest in a bond fund, a mutual fund or ETF, that exclusively holds bonds in its portfolio. These funds are convenient since they are usually low-cost and contain a broad base of diversified bonds so you don’t need to do your research to identify specific issues. When buying and selling these funds (or, for that matter, bonds themselves on the open market), keep in mind that these are “secondary market” transactions, meaning that you are buying from another investor and not directly from the issuer. One drawback of mutual funds and ETFs is that investors do not know the maturity of all the bonds in the fund portfolio since they are changing quite often, and therefore these investment vehicles are not appropriate for an investor who wishes to hold a bond until maturity. Another drawback is that you will have to pay additional fees to the portfolio managers, though bond funds tend to have lower expense ratios than their equity counterparts. Passively managed bond ETFs, which track a bond index, tend to have the fewest expenses of all. Bond ETFs pay out interest through a monthly dividend, while any capital gains are paid out through an annual dividend. Bond ETFs offer many of the same features of an individual bond, including a regular coupon payment. One of the most significant benefits of owning bonds is the chance to receive fixed payments on a regular schedule. These payments traditionally happen every six months. Bond ETFs, in contrast, hold assets with different maturity dates, so at any given time, some bonds in the portfolio may be due for a coupon payment. For this reason, bond ETFs pay interest each month with the value of the coupon varying from month to month.

    Assets in the fund are continually changing and do not mature. Instead, bonds are bought and sold as they expire or exit the target age range of the fund.  The suppliers of bond ETFs get around the liquidity problem by using representative sampling, which simply means tracking only a sufficient number of bonds to represent an index. Since a bond ETF never matures, there isn’t a guarantee the principal will be repaid in full.

    Common Bond-Buying mistakes

    1. Ignoring Interest Rate Moves

    Interest rates and bond prices have an inverse relationship. As rates go up, bond prices decline, and vice versa. This means that in the period before a bond’s redemption on its maturity date. the price of the issue will vary widely as interest rates fluctuate. Many investors don’t realize this.

    2. Not Noting the Claim Status

    Not all bonds are created equal. There are senior notes, which are often backed by collateral (such as equipment) that are given the first claim to company asset in case of bankruptcy and liquidation. There are also subordinate debentures, which still rank ahead of common stock in terms of claim preference, but below that of the senior debt holder. It is important to understand which type of debt you own, especially if the issue you are buying is in any way speculative.

    In the event of bankruptcy, bond investors have the first claim to a company’s assets. In other words, at least theoretically, they have a better chance of being made whole if the underlying company goes out of business. To determine what type of bond you own, check the certificate if possible. It will likely say the words “senior note,” or indicate the bond’s status in some other fashion on the document. Alternatively, the broker that sold you the note should be able to provide that information. If the bond is an initial issue the investor can look at the underlying company’s financial documents, such as the 10-K or the prospect.

    3. Assuming a Company is Sound

    Just because you own a bond or because it is highly regarded in the investment community doesn’t guarantee that you will earn a dividend payment, or that you will ever see the bond redeemed. In many ways, investors seem to take this process for granted.

    But rather than make the assumption that the investment is sound, the investor should review the company’s financials and look for any reason it won’t be able to service its obligation.

    They should look closely at the income statement and then take the annual net income figure and add back taxes, depreciation, and any other non-cash charges. This will help you to determine how many times that figure exceeds the annual debt service number. Ideally, there should be at least two times coverage in order to feel comfortable that the company will have the ability to pay down its debt.

    4. Misjudging Market Perception

    As mentioned above, bond prices can and do fluctuate. One of the biggest sources of volatility is the market’s perception of the issue and the issuer. If other investors don’t like the issue or think the company won’t be able to meet its obligations, or if the issuer suffers a blow to its reputation, the price of the bond will decrease in value. The opposite is true if Wall Street views the issuer or the issue favorably.

    A good tip for bond investors is to take a look at the issuer’s common stock to see how it is being perceived. If it is disliked, or there is unfavorable research in the public domain on the equity, it will likely spill over and be reflected in the price of the bond as well.

    5. Failing to Check the History

    It is important for an investor to look over old annual reports and review a company’s past performance to determine whether it has a history of reporting consistent earnings. Verify that the company has made all interest, tax, and pension plan obligation payments in the past.

    Specifically, a potential investor should read the company’s management discussion and analysis (MD&A) section for this information. Also, read the proxy statement—it, too, will yield clues about any problems or a company’s past inability to make payments. It may also indicate future risks that could have an adverse impact on a company’s ability to meet its obligations or service its debt.

    The goal of this homework is to gain some level of comfort that the bond you are holding isn’t some type of experiment. In other words, check that the company has paid its debts in the past and, based upon its past and expected future earnings is likely to do so in the future.

    Illustration 8; Pacific Railroad Bond issued by City and County of San Francisco, CA. May 1, 1865

    6. Ignoring Inflation Trends

    When bond investors hear reports of inflation trends, they need to pay attention. Inflation can eat away a fixed income investor’s future purchasing power quite easily.

    For example, if inflation is growing at an annual rate of four percent, this means that each year it will take a four percent greater return to maintain the same purchasing power. This is important, particularly for investors that buy bonds at or below the rate of inflation, because they are actually guaranteeing they’ll lose money when they purchase the security.

    Of course, this is not to say that an investor shouldn’t buy a low-yielding bond from a highly-rated corporation. But investors should understand that in order to defend against inflation, they must obtain a higher rate of return from other investments in their portfolio such as common stocks or high-yielding bonds.

    7. Failing to Check Liquidity

    Financial publications, market data/quote services, brokers and a company’s website may provide information about the liquidity of the issue you hold. More specifically, one of these sources may yield information about what type of volume the bond trades on a daily basis.

    This is important because bondholders need to know that if they want to dispose of their position, adequate liquidity will ensure that there will be buyers in the market ready to assume it. Generally speaking, the stocks and bonds of large, well-financed companies tend to be more liquid than those of smaller companies. The reason for this is simple — larger companies are perceived as having a greater ability to repay their debts.

    Warren Buffett:

    Intro to Bonds: A guide

    A bond is a fixed income instrument that represent a loan made by an investor to a borrower (typically corporate or government).  Bonds are used by companies, municipalities, states, and sovereign governments to finance projects and operations. Owners of bonds are debtholders, or creditors, of the issuer. A bond is referred to as a fixed income instrument since bonds traditionally paid a fixed interest rate (coupon) to debtholders. Variable or floating interest rates are also now quite common. Bond prices are inversely correlated with interest rates: when rates go up, bond prices fall and vice-versa. Bonds have maturity dates at which point the principal amount must be paid back in full or risk default.

    Governments and corporations commonly use bonds in order to borrow money. Governments need to fund roads, schools, dams or other infrastructure. The sudden expense of war may also demand the need to raise funds. Similarly, corporations will often borrow to grow their business, to buy property and equipment, to undertake profitable projects, for research and development or to hire employees. Large organizations often need more money than the average bank can provide, and bonds can be the solution by allowing many individual investors to assume the role of the lender. Moreover, markets allow lenders to sell their bonds to other investors or to buy bonds from other individuals—long after the original issuing organization raised capital.

    Illustration 1: An original Bond Issue

    The borrower (issuer) issues a bond that includes the terms of the loan, interest payments that will be made, and the time at which the loaned funds (bond principal) must be paid back (maturity date). The interest payment (the coupon) is part of the return that bondholders earn for loaning their funds to the issuer. The interest rate that determines the payment is called the coupon rate.

    The initial price of most bonds is typically set at par, usually $100 or $1,000 face value per individual bond. The actual market price of a bond depends on a number of factors: the credit quality of the issuer, the length of time until expiration, and the coupon rate compared to the general interest rate environment at the time. The face value of the bond is what will be paid back to the borrower once the bond matures.

    Most bonds can be sold by the initial bondholder to other investors after they have been issued. It is also common for bonds to be repurchased by the borrower if interest rates decline, or if the borrower’s credit has improved, and it can reissue new bonds at a lower cost.

    Characteristics of Bonds

    • Face value is the money amount the bond will be worth at maturity; it is also the reference amount the bond issuer uses when calculating interest payments. For example, say an investor purchases a bond at a premium $1,090 and another investor buys the same bond later when it is trading at a discount for $980. When the bond matures, both investors will receive the $1,000 face value of the bond.
    • The coupon rate is the rate of interest the bond issuer will pay on the face value of the bond, expressed as a percentage. For example, a 5% coupon rate means that bondholders will receive 5% x $1000 face value = $50 every year. Two features of a bond—credit quality and time to maturity—are the principal determinants of a bond’s coupon rate. If the issuer has a poor credit rating, the risk of default is greater, and these bonds pay more interest. Bonds that have a very long maturity date also usually pay a higher interest rate. This higher compensation is because the bondholder is more exposed to interest rate and inflation risks for an extended period. Credit ratings for a company and its bonds are generated by credit rating agencies like Standard and Poor’s, Moody’s, and Fitch ratings.. The very highest quality bonds are called ‘investment grade’ and include debt issued by the U.S. government and very stable companies, like many utilities. Bonds that are not considered investment grade, but are not in default, are called ‘high yield” or “junk” bonds. These bonds have a higher risk of default in the future and investors demand a higher coupon payment to compensate them for that risk.
    • Coupon dates are the dates on which the bond issuer will make interest payments. Payments can be made in any interval, but the standard is semiannual payments.
    • The maturity date is the date on which the bond will mature and the bond issuer will pay the bondholder the face value of the bond.
    • The issue price is the price at which the bond issuer originally sells the bonds.

    Bonds and bond portfolios will rise or fall in value as interest rates change. The sensitivity to changes in the interest rate environment is called “duration”. The use of the term duration in this context can be confusing to new bond investors because it does not refer to the length of time the bond has before maturity. Instead, duration describes how much a bond’s price will rise or fall with a change in interest rates.

    Categories of Bonds:

    Corporate bonds are issued by companies. Companies issue bonds rather than seek bank loans for debt financing in many cases because bond markets offer more favorable terms and lower interest rates.

    Illustration 2: Bond issued by the Dutch East India Company in 1623

    Municipal bonds are issued by states and municipalities. Some municipal bonds offer tax-free coupon income for investors.

    Government bonds such as those issued by the U.S. Treasury. Bonds issued by the Treasury with a year or less to maturity are called “Bills”; bonds issued with 1–10 years to maturity are called “notes”; and bonds issued with more than 10 years to maturity are called “bonds”. The entire category of bonds issued by a government treasury is often collectively referred to as “treasuries.” Government bonds issued by national governments may be referred to as sovereign debt.

    Agency bonds are those issued by government-affiliated organizations such as Fannie Mae or Freddie Mac.

    Varieties of Bonds

    Zero-coupon bonds do not pay coupon payments and instead are issued at a discount to their par value that will generate a return once the bondholder is paid the full face value when the bond matures. U.S. Treasury bills are a zero-coupon bond.

    Convertible bonds are debt instruments with an embedded option that allows bondholders to convert their debt into stock at some point, depending on certain conditions like the share price. For example, imagine a company that needs to borrow $1 million to fund a new project. They could borrow by issuing bonds with a 12% coupon that matures in 10 years. However, if they knew that there were some investors willing to buy bonds with an 8% coupon that allowed them to convert the bond into stock if the stock’s price rose above a certain value, they might prefer to issue those. The convertible bond may the best solution for the company because they would have lower interest payments while the project was in its early stages. If the investors converted their bonds, the other shareholders would be diluted, but the company would not have to pay any more interest or the principal of the bond. The investors who purchased a convertible bond may think this is a great solution because they can profit from the upside in the stock if the project is successful. They are taking more risk by accepting a lower coupon payment, but the potential reward if the bonds are converted could make that trade-off acceptable.

    Callable bonds also have an embedded option but it is different than what is found in a convertible bond. A callable bond is one that can be “called” back by the company before it matures. Assume that a company has borrowed $1 million by issuing bonds with a 10% coupon that mature in 10 years. If interest rates decline (or the company’s credit rating improves) in year 5 when the company could borrow for 8%, they will call or buy the bonds back from the bondholders for the principal amount and reissue new bonds at a lower coupon rate. A callable bond is riskier for the bond buyer because the bond is more likely to be called when it is rising in value. Remember, when interest rates are falling, bond prices rise. Because of this, callable bonds are not as valuable as bonds that aren’t callable with the same maturity, credit rating, and coupon rate.

    Illustration 3: A Swedish bond from 1955.

    Puttable bond allows the bondholders to put or sell the bond back to the company before it has matured. This is valuable for investors who are worried that a bond may fall in value, or if they think interest rates will rise and they want to get their principal back before the bond falls in value. The bond issuer may include a put option in the bond that benefits the bondholders in return for a lower coupon rate or just to induce the bond sellers to make the initial loan. A puttable bond usually trades at a higher value than a bond without a put option but with the same credit rating, maturity, and coupon rate because it is more valuable to the bondholders.

    The possible combinations of embedded puts, calls, and convertibility rights in a bond are endless and each one is unique. There isn’t a strict standard for each of these rights and some bonds will contain more than one kind of “option” which can make comparisons difficult. Generally, individual investors rely on bond professionals to select individual bonds or bond funds that meet their investing goals.

    Pricing Bonds

    The market prices bonds based on their particular characteristics. A bond’s price changes on a daily basis. But there is a logic to how bonds are valued. Bonds do not have to be held to maturity. At any time, a bondholder can sell their bonds in the open market, where the price can fluctuate, sometimes dramatically.

    The price of a bond changes in response to changes in interest rates in the economy. This is due to the fact that for a fixed-rate bond the issuer has promised to pay a coupon based on the face value of the bond—so for a $1,000 par, 10% annual coupon bond, the issuer will pay the bondholder $100 each year. Say that prevailing interest rates are also 10% at the time that this bond is issued, as determined by the rate on a short-term government bond. An investor would be indifferent investing in the corporate bond or the government bond since both would return $100. However, imagine a little while later, that the economy has taken a turn for the worse and interest rates dropped to 5%. Now, the investor can only receive $50 from the government bond, but would still receive $100 from the corporate bond.

    This difference makes the corporate bond much more attractive. So, investors in the market will bid up to the price of the bond until it trades at a premium that equalizes the prevailing interest rate environment—in this case, the bond will trade at a price of $2,000 so that the $100 coupon represents 5%. Likewise, if interest rates soared to 15%, then an investor could make $150 from the government bond and would not pay $1,000 to earn just $100. This bond would be sold until it reached a price that equalized the yields, in this case to a price of $666.67.

    Illustration 4: Railroad obligation of the Moscow-Kiev-Voronezh railroad company, printed in Russian, Dutch and German.

    Inverse to Interest Rates

    This is why the famous statement that a bond’s price varies inversely with interest rates works. When interest rates go up, bond prices fall in order to have the effect of equalizing the interest rate on the bond with prevailing rates, and vice versa.

    Another way of illustrating this concept is to consider what the yield on our bond would be given a price change, instead of given an interest rate change. For example, if the price were to go down from $1,000 to $800, then the yield goes up to 12.5%. This happens because you are getting the same guaranteed $100 on an asset that is worth $800 ($100/$800). Conversely, if the bond goes up in price to $1,200, the yield shrinks to 8.33% ($100/$1,200).

    Bond Risk

    Bonds are relatively safe investments, but just like any other investment they do come with a risk.

    Interest Rate Risk: Interest rates share an inverse relationship with bonds, so when rates rise, bonds tend to fall and vice versa. Interest rate risk comes when rates change significantly from what the investor expected. If interest rates decline significantly, the investor faces the possibility of prepayment. If interest rates rise, the investor will be stuck with an instrument yielding below market rates. The greater the time to maturity, the greater the risk.

    Credit or default risk is the risk that interest and principal payments due on the obligation will not be made as required. When an investor buys a bond, they expect that the issuer will make good on the interest and principal payments—just like any other creditor. When an investor looks into corporate bonds, they should weigh out the possibility that the company may default on the debt. Safety usually means the company has greater operating income and cash flow compared to its debt. If the inverse is true and the debt outweighs available cash, the investor may want to stay away.

    Illustration 6: Bond certificate for the state of South Carolina issued in 1873 under the state’s Consolidation Act.

    Prepayment risk is the risk that a given bond issue will be paid off earlier than expected, normally through a call provision.  This can be bad news for investors because the company only has an incentive to repay the obligation early when interest rates have declined substantially. Instead of continuing to hold a high-interest investment, investors are left to reinvest funds in a lower interest rate environment.

    Reinvestment risk, a bond poses a reinvestment risk to investors if the proceeds from the bond or future cash flows will need to be reinvested in a security with a lower yield than the bond originally provided. Reinvestment risk can also come with callable bonds—investments that can be called by the issuer before the maturity rate.

    For example, imagine an investor buys a $1,000 bond with an annual coupon of 12%. Each year, the investor receives $120 (12% x $1,000), which can be reinvested back into another bond. But imagine that, over time, the market rate falls to 1%. Suddenly, that $120 received from the bond can only be reinvested at 1%, instead of the 12% rate of the original bond.

    Another risk is that a bond will be called by its issuer. Callable bonds have call provision that allow the bond issuer to purchase the bond back from the bondholders and retire the issue. This is usually done when interest rate fall substantially since the issue date. Call provisions allow the issuer to retire the old, high-rate bonds and sell low-rate bonds in a bid to lower debt costs.

    Default risk occurs when the bond’s issuer is unable to pay the contractual interest or principal on the bond in a timely manner or at all. Credit rating services give credit ratings to bond issues.  For example, most federal governments have very high credit ratings (AAA). However, small emerging companies have some of the worst credit—BB and lower—and are more likely to default on their bond payments. In these cases, bondholders will likely lose all or most of their investments.

    Inflation Risk- This risk refers to situations when the rate of price increases in the economy deteriorates the returns associated with the bond. This has the greatest effect on fixed bonds, which have a set interest rate from inception.

    How to buy a bond

    Bond Broker- Many specialized bond brokerages require high minimum initial deposits; $5,000 is typical. There may also be account maintenance fees. And of course, commissions on trades. Depending on the quantity and type of bond purchased, broker commissions can range from 0.5% to 2%. When using a broker (even your regular one) to purchase bonds, you may be told that the trade is free of commison. What often happens, however, is that the price is marked up so that the cost you are charged essentially includes a compensatory fee. If the broker isn’t earning anything off of the transaction, he or she probably would not offer the service. For example, say you placed an order for 10 corporate bonds that were trading at $1,025 per bond. You’d be told, though, that they cost $1,035.25 per bond, so the total price of your investment comes not to $10,250 but to $10,352.50. The difference represents an effective 1% commission for the broker. To determine the markup before purchase, look up the latest quote for the bond; you can also use the TRACE, which shows all over-the-counter (OTC) transactions for the secondary bond market. Use your discretion to decide whether or not the commission fee is excessive or one you are willing to accept.

    Buying Government Bonds-Purchasing government bonds such as Treasuries (U.S.) or Canada Savings Bonds (Canada) works slightly differently than buying corporate or municipal bonds. Many financial institutions provide services to their clients that allow them to purchase government bonds through their regular investment accounts. If this service is not available to you through your bank or brokerage, you also have the option to purchase these securities directly from the government.

    Illustration 7: A USA Bond issuance

    Bond Funds- Another way to gain exposure in bonds would be to invest in a bond fund, a mutual fund or ETF, that exclusively holds bonds in its portfolio. These funds are convenient since they are usually low-cost and contain a broad base of diversified bonds so you don’t need to do your research to identify specific issues. When buying and selling these funds (or, for that matter, bonds themselves on the open market), keep in mind that these are “secondary market” transactions, meaning that you are buying from another investor and not directly from the issuer. One drawback of mutual funds and ETFs is that investors do not know the maturity of all the bonds in the fund portfolio since they are changing quite often, and therefore these investment vehicles are not appropriate for an investor who wishes to hold a bond until maturity. Another drawback is that you will have to pay additional fees to the portfolio managers, though bond funds tend to have lower expense ratios than their equity counterparts. Passively managed bond ETFs, which track a bond index, tend to have the fewest expenses of all. Bond ETFs pay out interest through a monthly dividend, while any capital gains are paid out through an annual dividend. Bond ETFs offer many of the same features of an individual bond, including a regular coupon payment. One of the most significant benefits of owning bonds is the chance to receive fixed payments on a regular schedule. These payments traditionally happen every six months. Bond ETFs, in contrast, hold assets with different maturity dates, so at any given time, some bonds in the portfolio may be due for a coupon payment. For this reason, bond ETFs pay interest each month with the value of the coupon varying from month to month.

    Assets in the fund are continually changing and do not mature. Instead, bonds are bought and sold as they expire or exit the target age range of the fund.  The suppliers of bond ETFs get around the liquidity problem by using representative sampling, which simply means tracking only a sufficient number of bonds to represent an index. Since a bond ETF never matures, there isn’t a guarantee the principal will be repaid in full.

    Common Bond-Buying mistakes

    1. Ignoring Interest Rate Moves

    Interest rates and bond prices have an inverse relationship. As rates go up, bond prices decline, and vice versa. This means that in the period before a bond’s redemption on its maturity date. the price of the issue will vary widely as interest rates fluctuate. Many investors don’t realize this.

    2. Not Noting the Claim Status

    Not all bonds are created equal. There are senior notes, which are often backed by collateral (such as equipment) that are given the first claim to company asset in case of bankruptcy and liquidation. There are also subordinate debentures, which still rank ahead of common stock in terms of claim preference, but below that of the senior debt holder. It is important to understand which type of debt you own, especially if the issue you are buying is in any way speculative.

    In the event of bankruptcy, bond investors have the first claim to a company’s assets. In other words, at least theoretically, they have a better chance of being made whole if the underlying company goes out of business. To determine what type of bond you own, check the certificate if possible. It will likely say the words “senior note,” or indicate the bond’s status in some other fashion on the document. Alternatively, the broker that sold you the note should be able to provide that information. If the bond is an initial issue the investor can look at the underlying company’s financial documents, such as the 10-K or the prospect.

    3. Assuming a Company is Sound

    Just because you own a bond or because it is highly regarded in the investment community doesn’t guarantee that you will earn a dividend payment, or that you will ever see the bond redeemed. In many ways, investors seem to take this process for granted.

    But rather than make the assumption that the investment is sound, the investor should review the company’s financials and look for any reason it won’t be able to service its obligation.

    They should look closely at the income statement and then take the annual net income figure and add back taxes, depreciation, and any other non-cash charges. This will help you to determine how many times that figure exceeds the annual debt service number. Ideally, there should be at least two times coverage in order to feel comfortable that the company will have the ability to pay down its debt.

    4. Misjudging Market Perception

    As mentioned above, bond prices can and do fluctuate. One of the biggest sources of volatility is the market’s perception of the issue and the issuer. If other investors don’t like the issue or think the company won’t be able to meet its obligations, or if the issuer suffers a blow to its reputation, the price of the bond will decrease in value. The opposite is true if Wall Street views the issuer or the issue favorably.

    A good tip for bond investors is to take a look at the issuer’s common stock to see how it is being perceived. If it is disliked, or there is unfavorable research in the public domain on the equity, it will likely spill over and be reflected in the price of the bond as well.

    5. Failing to Check the History

    It is important for an investor to look over old annual reports and review a company’s past performance to determine whether it has a history of reporting consistent earnings. Verify that the company has made all interest, tax, and pension plan obligation payments in the past.

    Specifically, a potential investor should read the company’s management discussion and analysis (MD&A) section for this information. Also, read the proxy statement—it, too, will yield clues about any problems or a company’s past inability to make payments. It may also indicate future risks that could have an adverse impact on a company’s ability to meet its obligations or service its debt.

    The goal of this homework is to gain some level of comfort that the bond you are holding isn’t some type of experiment. In other words, check that the company has paid its debts in the past and, based upon its past and expected future earnings is likely to do so in the future.

    Illustration 8; Pacific Railroad Bond issued by City and County of San Francisco, CA. May 1, 1865

    6. Ignoring Inflation Trends

    When bond investors hear reports of inflation trends, they need to pay attention. Inflation can eat away a fixed income investor’s future purchasing power quite easily.

    For example, if inflation is growing at an annual rate of four percent, this means that each year it will take a four percent greater return to maintain the same purchasing power. This is important, particularly for investors that buy bonds at or below the rate of inflation, because they are actually guaranteeing they’ll lose money when they purchase the security.

    Of course, this is not to say that an investor shouldn’t buy a low-yielding bond from a highly-rated corporation. But investors should understand that in order to defend against inflation, they must obtain a higher rate of return from other investments in their portfolio such as common stocks or high-yielding bonds.

    7. Failing to Check Liquidity

    Financial publications, market data/quote services, brokers and a company’s website may provide information about the liquidity of the issue you hold. More specifically, one of these sources may yield information about what type of volume the bond trades on a daily basis.

    This is important because bondholders need to know that if they want to dispose of their position, adequate liquidity will ensure that there will be buyers in the market ready to assume it. Generally speaking, the stocks and bonds of large, well-financed companies tend to be more liquid than those of smaller companies. The reason for this is simple — larger companies are perceived as having a greater ability to repay their debts.

    Warren Buffett:

    Silver investing: An overview

    Silver is a precious metal that has been used for thousands of years as a store of value, currency, and industrial commodity. It has unique properties that make it a valuable asset for investors looking to diversify their portfolio or protect against inflation. In this article, we will explore the various factors that affect the price of silver and the reasons why it is an attractive investment option.

    Supply and Demand

    Silver is a precious metal that is used as an element in jewelry, electronics, coins and photography. Silver as a metal has the highest electrical conductivity of any metal. Therefore, it is used in many industrial processes. Silver is also important in many cultures around the world as it is used in ceremonies or worn during important occasions. As with any commodity, the price of silver is heavily influenced by the balance between the supply and demand for the metal.

    Figure 1: Mining production can affect the price of silver

    The supply of silver is primarily driven by mining production. Silver is primarily produced as a byproduct of mining other metals like copper, lead, and zinc. As such, the supply of silver is heavily influenced by the mining industry’s production of these metals. If the production of these metals increases, the supply of silver will also increase, leading to a potential decrease in price. Conversely, if the production of these metals decreases, the supply of silver will also decrease, leading to a potential increase in price.

    Another factor that can affect the supply of silver is recycling. Silver can be recovered from a variety of sources, including electronic waste, jewelry, and industrial waste. The amount of silver that is recycled can impact the overall supply of the metal. If the amount of silver that is recycled increases, the supply of silver will also increase, leading to a potential decrease in price. Conversely, if the amount of silver that is recycled decreases, the supply of silver will also decrease, leading to a potential increase in price.

    Silver is an important industrial metal, with a wide range of uses in various industries. It is a key component in the production of electronics, solar panels, batteries, and medical equipment, among other things. As such, the demand for silver is largely tied to the health of the global economy. During times of economic growth, demand for silver tends to increase as industries expand and more products are produced. Conversely, during times of economic contraction, demand for silver tends to decline as industries contract and production slows down.

    Silver is also a popular investment asset, with investors using it to diversify their portfolios and protect against inflation. During times of economic uncertainty, investors tend to flock to safe-haven assets like silver, which can help to protect their wealth in the event of a market downturn. This can cause the price of silver to rise as demand increases.

    When it comes to the demand large traders or investors can have much to say. The silver market is much smaller than the gold market and is actually much smaller than many companies. The London gold market alone turns over 18 times more monetary value than silver. With physical demand estimated at around only $15 billion per year it may be possible for a large trader or investor to influence the silver price either positively or negatively. An example of this could be when the Hunt brothers were accused of attempting to corner the silver market in 1979.  They were estimated to have accumulated over 100 million troy ounces of silver, potentially contributing to the increase in price from $6 to $48.40 as seen in the graph below. The y-axis represent the nominal price of silver while the x-axis represents the year.

    A big driver for silver sales in 2012 was Morgan Stanley and their short position holdings. This has influenced the silver market, along with an apparent shortage of above ground silver available for investment. As silver continues to boom for industrial uses, less of the metal is available for physical bullion for investment. That, coupled with paper investment uncertainty, has driven the market prices wildly.

    Silver is also used in the production of jewelry. The demand for silver jewelry is largely driven by fashion trends and consumer preferences. In some cultures, silver is also used as a store of value or a form of currency, which can drive up demand for the metal.

    The interaction between supply and demand is what ultimately determines the price of silver. If the demand for silver is greater than the supply, the price will increase. Conversely, if the supply of silver is greater than the demand, the price will decrease. Worlds largest silver producers by country are : 1.Mexico, 2. Peru, 3. China, 4. Australia, 5. Chile, 6. Poland, 7. Russia, 8. Bolivia, 9. USA. Worlds largest silver consumers are: 1. USA, 2. China, 3. Japan, 4. India, 5. Germany, 6. Italy.


    Price elasticity is another important factor to consider when it comes to silver investing. Price elasticity refers to the degree to which the demand for silver changes in response to a change in price. If the demand for silver is highly elastic, meaning that even small changes in price can cause a significant change in demand, then the price of silver will be highly volatile. Conversely, if the demand for silver is relatively inelastic, meaning that changes in price have little impact on demand, then the price of silver will be relatively stable.

    Financial Stress/Hedging

    Silver is considered a safe heaven during times of volatility/ insecurity in the markets. So if there is volatility or one or more of the large currencies fail the price of silver will go up. Silver can also be used as a hedge against inflation and deflation.  A hedge is essentially a way to safeguard yourself when you are investing. You may feel vulnerable as you look at your portfolio, especially if experts are predicting a downturn. Hedging can be a form of insurance against the risk you feel you’re taking with the other items in your portfolio.

    You’ll see hedging as a strategy used by professional brokers as they help you build your portfolio. They’ll look at safer investments to offset the high-risk items they choose. The theory is that, if things go wrong, you’ll have some items in your portfolio that may be gaining or holding their value to help reduce your losses.

    Figure 3: Silver can be a hedge in uncertain times

    Political factors such as government policies, regulations, and trade agreements can impact the supply and demand of silver. In addition, political instability, such as war or civil unrest, can also lead to an increase in demand for safe-haven assets like silver, causing the price to rise.

    Despite the subtle dangers of silver, it’s popular with investors, especially during tough times. This puts it in the category of a safe haven, which is defined as an investment that is expected to hold its value as the market turns turbulent. However, no safe haven is guaranteed in every market, which means it’s important to research silver before putting money into it.

    Due to its slightly safer natur some investors choose to make silver a part of a larger portfolio. Although you won’t earn interest on that part of your portfolio over the years, it can be useful as a hedge against inflation. The fact that they tend to do better when other stocks are failing can help balance out your portfolio.

    Many still invest in silver and gold stocks, though, with the logic that metals tend to fare well during stock market crashes. While this has historically been true of gold, that same improved performance doesn’t apply to silver. Silver is used heavily in industrial sectors, which makes it more likely to be tied to the performance of the greater economy.

    Technology

    Silver is an important component in many electrical products. As more people use modern technology, the demand for silver slowly increases.

    Unlike gold, the price of silver swings between its perceived role as a store of value and its role as an industrial metal. For this reason, price fluctuations in the silver market are more volatile than gold. So, while silver will trade roughly in line with gold as an item to be hoarded, the industrial supply/demand equation for the metal exerts an equally strong influence on its price.

    Figure 4: Market for silver

    That equation has always fluctuated with new innovations, including: Silver’s once predominant role in the photography industry—silver-based photographic film—which has been eclipsed by the advent of the digital camera.

    The rise of a vast middle class in the emerging market economies of the East, which created an explosive demand for electrical appliances, medical products, and other industrial items that require silver inputs. From bearings to electrical connections, silver’s properties made it a desired commodity. Silver’s used in batteries, superconductor applications, and microcircuit markets.


    How to Buy Silver

    There are several ways to invest in silver, including physical silver, exchange-traded funds (ETFs), futures contracts, and mining stocks. Each of these investment options has its own advantages and disadvantages, and investors should carefully consider their options before making a decision.

    Investors can invest in silver through ETFs, which track the price of silver and trade like stocks. ETFs offer investors the ability to invest in silver without actually owning the physical metal, making them a convenient and cost-effective investment option.

    Funds like the iShares Silver Trust (SLV) have made it quite easy for regular retail investors to enter the silver market. This industrial demand makes silver prices more volatile than gold and generally reactive to various measures of manufacturing data. Given this fact, ETFs that track silver prices or futures could be a better bet versus physical bullion, as they can be sold quite easily if investors think prices are too frothy.

    American Eagle is a famous silver brand

    Then there are costs to consider. Buying physical silver comes with added costs many investors may not be thinking of. First, investors have to pay an average of 5% to 6% in commissions to acquire silver coins and bullion, depending on the source. Then there are the storage costs to consider. Safety deposit boxes at banks carry an annual fee and home safes can range into the thousands, depending on the size, while precious metals IRAs and custodial accounts come with yearly storage fees as well.

    For the cost of just one share that trades at roughly spot price and as little as 0.50% in yearly expenses, investors can access silver via an ETF. A perfect example of the potential problems with ETF stems from the bankruptcy of MF global in the late 2011. Investors who held warehouse silver bars within the firm’s accounts had their assets frozen and pooled together. The liquidating trustee in the court-approved bankruptcy paid these investors about 72 cents on the dollar for their holdings. In other words, these investors lost 28% of their bullion. With some silver participants claiming manipulation in the silver markets with regards to many of the big ETF/ETN sponsors, owning physical bullion could pay-off in the real end.

    Finally, ETF fees do have an eroding effect on their underlying prices. Many of the physically-backed funds sell a portion of their bullion to pay for their expenses. Over time, this has caused share prices to track less than spot. Shareholders don’t actually own title to the metal itself unless they are an authorized participent in an ETF. On the other hand, when you own actual silver it’s yours. If the world goes “crazy,” you have the store of value directly in your own hands or vault. This fact underscores the number one reason why most investors choose precious metals in the first place: insurance.

    The third way to invest in silver is by buying silver mining stocks. Publicly-traded silver mining companies are located across the globe and can help you make a profit. As silver prices rise and fall, you’ll see your stocks in mining companies follow those trends. However, events such as an accident may affect a mining company even when silver is performing well.

    Another option is to invest in something called a silver streaming company. A streaming company doesn’t directly deal in mining steel but instead offers financing to them in exchange for shares. These streaming companies are also affected by fluctuations in silver prices, but their ability to keep a steady stream of financing deals can also affect their stocks.

    Investors can also invest in silver through futures contracts, which allow them to purchase silver

    Warren Buffet (did not make much money on it/don’t advise it), “didn’t get where we are by owning silver”- Charlie Monger.

    Silver investing: An overview

    Silver is a precious metal that has been used for thousands of years as a store of value, currency, and industrial commodity. It has unique properties that make it a valuable asset for investors looking to diversify their portfolio or protect against inflation. In this article, we will explore the various factors that affect the price of silver and the reasons why it is an attractive investment option.

    Supply and Demand

    Silver is a precious metal that is used as an element in jewelry, electronics, coins and photography. Silver as a metal has the highest electrical conductivity of any metal. Therefore, it is used in many industrial processes. Silver is also important in many cultures around the world as it is used in ceremonies or worn during important occasions. As with any commodity, the price of silver is heavily influenced by the balance between the supply and demand for the metal.

    Figure 1: Mining production can affect the price of silver

    The supply of silver is primarily driven by mining production. Silver is primarily produced as a byproduct of mining other metals like copper, lead, and zinc. As such, the supply of silver is heavily influenced by the mining industry’s production of these metals. If the production of these metals increases, the supply of silver will also increase, leading to a potential decrease in price. Conversely, if the production of these metals decreases, the supply of silver will also decrease, leading to a potential increase in price.

    Another factor that can affect the supply of silver is recycling. Silver can be recovered from a variety of sources, including electronic waste, jewelry, and industrial waste. The amount of silver that is recycled can impact the overall supply of the metal. If the amount of silver that is recycled increases, the supply of silver will also increase, leading to a potential decrease in price. Conversely, if the amount of silver that is recycled decreases, the supply of silver will also decrease, leading to a potential increase in price.

    Silver is an important industrial metal, with a wide range of uses in various industries. It is a key component in the production of electronics, solar panels, batteries, and medical equipment, among other things. As such, the demand for silver is largely tied to the health of the global economy. During times of economic growth, demand for silver tends to increase as industries expand and more products are produced. Conversely, during times of economic contraction, demand for silver tends to decline as industries contract and production slows down.

    Silver is also a popular investment asset, with investors using it to diversify their portfolios and protect against inflation. During times of economic uncertainty, investors tend to flock to safe-haven assets like silver, which can help to protect their wealth in the event of a market downturn. This can cause the price of silver to rise as demand increases.

    When it comes to the demand large traders or investors can have much to say. The silver market is much smaller than the gold market and is actually much smaller than many companies. The London gold market alone turns over 18 times more monetary value than silver. With physical demand estimated at around only $15 billion per year it may be possible for a large trader or investor to influence the silver price either positively or negatively. An example of this could be when the Hunt brothers were accused of attempting to corner the silver market in 1979.  They were estimated to have accumulated over 100 million troy ounces of silver, potentially contributing to the increase in price from $6 to $48.40 as seen in the graph below. The y-axis represent the nominal price of silver while the x-axis represents the year.

    A big driver for silver sales in 2012 was Morgan Stanley and their short position holdings. This has influenced the silver market, along with an apparent shortage of above ground silver available for investment. As silver continues to boom for industrial uses, less of the metal is available for physical bullion for investment. That, coupled with paper investment uncertainty, has driven the market prices wildly.

    Silver is also used in the production of jewelry. The demand for silver jewelry is largely driven by fashion trends and consumer preferences. In some cultures, silver is also used as a store of value or a form of currency, which can drive up demand for the metal.

    The interaction between supply and demand is what ultimately determines the price of silver. If the demand for silver is greater than the supply, the price will increase. Conversely, if the supply of silver is greater than the demand, the price will decrease. Worlds largest silver producers by country are : 1.Mexico, 2. Peru, 3. China, 4. Australia, 5. Chile, 6. Poland, 7. Russia, 8. Bolivia, 9. USA. Worlds largest silver consumers are: 1. USA, 2. China, 3. Japan, 4. India, 5. Germany, 6. Italy.


    Price elasticity is another important factor to consider when it comes to silver investing. Price elasticity refers to the degree to which the demand for silver changes in response to a change in price. If the demand for silver is highly elastic, meaning that even small changes in price can cause a significant change in demand, then the price of silver will be highly volatile. Conversely, if the demand for silver is relatively inelastic, meaning that changes in price have little impact on demand, then the price of silver will be relatively stable.

    Financial Stress/Hedging

    Silver is considered a safe heaven during times of volatility/ insecurity in the markets. So if there is volatility or one or more of the large currencies fail the price of silver will go up. Silver can also be used as a hedge against inflation and deflation.  A hedge is essentially a way to safeguard yourself when you are investing. You may feel vulnerable as you look at your portfolio, especially if experts are predicting a downturn. Hedging can be a form of insurance against the risk you feel you’re taking with the other items in your portfolio.

    You’ll see hedging as a strategy used by professional brokers as they help you build your portfolio. They’ll look at safer investments to offset the high-risk items they choose. The theory is that, if things go wrong, you’ll have some items in your portfolio that may be gaining or holding their value to help reduce your losses.

    Figure 3: Silver can be a hedge in uncertain times

    Political factors such as government policies, regulations, and trade agreements can impact the supply and demand of silver. In addition, political instability, such as war or civil unrest, can also lead to an increase in demand for safe-haven assets like silver, causing the price to rise.

    Despite the subtle dangers of silver, it’s popular with investors, especially during tough times. This puts it in the category of a safe haven, which is defined as an investment that is expected to hold its value as the market turns turbulent. However, no safe haven is guaranteed in every market, which means it’s important to research silver before putting money into it.

    Due to its slightly safer natur some investors choose to make silver a part of a larger portfolio. Although you won’t earn interest on that part of your portfolio over the years, it can be useful as a hedge against inflation. The fact that they tend to do better when other stocks are failing can help balance out your portfolio.

    Many still invest in silver and gold stocks, though, with the logic that metals tend to fare well during stock market crashes. While this has historically been true of gold, that same improved performance doesn’t apply to silver. Silver is used heavily in industrial sectors, which makes it more likely to be tied to the performance of the greater economy.

    Technology

    Silver is an important component in many electrical products. As more people use modern technology, the demand for silver slowly increases.

    Unlike gold, the price of silver swings between its perceived role as a store of value and its role as an industrial metal. For this reason, price fluctuations in the silver market are more volatile than gold. So, while silver will trade roughly in line with gold as an item to be hoarded, the industrial supply/demand equation for the metal exerts an equally strong influence on its price.

    Figure 4: Market for silver

    That equation has always fluctuated with new innovations, including: Silver’s once predominant role in the photography industry—silver-based photographic film—which has been eclipsed by the advent of the digital camera.

    The rise of a vast middle class in the emerging market economies of the East, which created an explosive demand for electrical appliances, medical products, and other industrial items that require silver inputs. From bearings to electrical connections, silver’s properties made it a desired commodity. Silver’s used in batteries, superconductor applications, and microcircuit markets.


    How to Buy Silver

    There are several ways to invest in silver, including physical silver, exchange-traded funds (ETFs), futures contracts, and mining stocks. Each of these investment options has its own advantages and disadvantages, and investors should carefully consider their options before making a decision.

    Investors can invest in silver through ETFs, which track the price of silver and trade like stocks. ETFs offer investors the ability to invest in silver without actually owning the physical metal, making them a convenient and cost-effective investment option.

    Funds like the iShares Silver Trust (SLV) have made it quite easy for regular retail investors to enter the silver market. This industrial demand makes silver prices more volatile than gold and generally reactive to various measures of manufacturing data. Given this fact, ETFs that track silver prices or futures could be a better bet versus physical bullion, as they can be sold quite easily if investors think prices are too frothy.

    American Eagle is a famous silver brand

    Then there are costs to consider. Buying physical silver comes with added costs many investors may not be thinking of. First, investors have to pay an average of 5% to 6% in commissions to acquire silver coins and bullion, depending on the source. Then there are the storage costs to consider. Safety deposit boxes at banks carry an annual fee and home safes can range into the thousands, depending on the size, while precious metals IRAs and custodial accounts come with yearly storage fees as well.

    For the cost of just one share that trades at roughly spot price and as little as 0.50% in yearly expenses, investors can access silver via an ETF. A perfect example of the potential problems with ETF stems from the bankruptcy of MF global in the late 2011. Investors who held warehouse silver bars within the firm’s accounts had their assets frozen and pooled together. The liquidating trustee in the court-approved bankruptcy paid these investors about 72 cents on the dollar for their holdings. In other words, these investors lost 28% of their bullion. With some silver participants claiming manipulation in the silver markets with regards to many of the big ETF/ETN sponsors, owning physical bullion could pay-off in the real end.

    Finally, ETF fees do have an eroding effect on their underlying prices. Many of the physically-backed funds sell a portion of their bullion to pay for their expenses. Over time, this has caused share prices to track less than spot. Shareholders don’t actually own title to the metal itself unless they are an authorized participent in an ETF. On the other hand, when you own actual silver it’s yours. If the world goes “crazy,” you have the store of value directly in your own hands or vault. This fact underscores the number one reason why most investors choose precious metals in the first place: insurance.

    The third way to invest in silver is by buying silver mining stocks. Publicly-traded silver mining companies are located across the globe and can help you make a profit. As silver prices rise and fall, you’ll see your stocks in mining companies follow those trends. However, events such as an accident may affect a mining company even when silver is performing well.

    Another option is to invest in something called a silver streaming company. A streaming company doesn’t directly deal in mining steel but instead offers financing to them in exchange for shares. These streaming companies are also affected by fluctuations in silver prices, but their ability to keep a steady stream of financing deals can also affect their stocks.

    Investors can also invest in silver through futures contracts, which allow them to purchase silver

    Warren Buffet (did not make much money on it/don’t advise it), “didn’t get where we are by owning silver”- Charlie Monger.

    Page 4 of 4

    Powered by WordPress & Theme by Anders Norén