Tag: Cars

Toyota Motor Corp. – A Stock Analysis of one of the leading automakers of the world

Introduction

Toyota Motor Corporation is a globally renowned Japanese multinational automotive manufacturer, widely regarded as one of the world’s leading innovators in mobility, automotive engineering, and sustainable transportation.

The Toyota logo has an ingenious hidden message | Creative Bloq

Illustration 1: he Toyota logo, a symbol of trust, innovation, and global mobility.

Headquartered in Toyota City, Japan, the company is best known for its high-quality vehicles and pioneering work in hybrid technology, but its operations span a broad spectrum including robotics, AI, autonomous driving, and hydrogen fuel cell systems.

Unlike many Western automakers that evolved in tandem with the American and European car industries, Toyota carved a unique path grounded in the principles of Kaizen (continuous improvement) and Just-In-Time manufacturing, revolutionizing global automotive production with the Toyota Production System (TPS). Its reputation for reliability, efficiency, and innovation has made it a household name in markets around the world.

Toyota is consistently ranked among the top global automakers by volume and market capitalization. It has spearheaded the automotive industry’s shift toward sustainability through its leadership in hybrid technology (beginning with the Prius) and its bold push into hydrogen-powered and battery electric vehicles. With a growing focus on AI, connected vehicles, and mobility-as-a-service, Toyota continues to shape the future of transportation.

History

Toyota was founded in 1937 by Kiichiro Toyoda, evolving from Toyoda Automatic Loom Works. Initially focused on producing passenger cars for the Japanese market, the company quickly established itself with models like the Toyota AA and developed a reputation for durable vehicles in the post-war period.

How Toyota's first car vanished, re-emerging years later in Russia

Illustration 2: The first Toyota passenger car was the Toyoda Model AA

The real global breakthrough came during the 1970s and 1980s, when Toyota expanded aggressively into North America and Europe. Its compact, fuel-efficient cars, such as the Corolla and Camry, gained popularity during the oil crisis, helping it gain a foothold in key international markets.


Toyota became a global icon of manufacturing excellence with the development of the Toyota Production System (TPS) which is a manufacturing philosophy that transformed supply chains worldwide. In 1997, it launched the Prius, the world’s first mass-produced hybrid electric vehicle, cementing Toyota’s role as an environmental pioneer in the auto industry.

In the 2010s, Toyota expanded into next-generation mobility, investing in AI research, autonomous driving (under its subsidiary Woven by Toyota), and alternative energy sources such as hydrogen fuel cells (Mirai). The company has continued to build its brand as not just an automaker but a mobility solutions provider.

Today, Toyota operates over 50 manufacturing facilities worldwide and sells vehicles in more than 170 countries. It remains the world’s largest automaker by units sold, combining innovation with a deep commitment to quality and sustainability. Its reputation is that their cars will last for ever due to their quality.

Operations and Production

  • Portfolio

Toyota is a car company and it’s core operations center around the development, manufacturing, and sale of automobiles, including sedans, SUVs, trucks, and commercial vehicles. Its flagship models include the Corolla (the world’s best-selling car), Camry, Land Cruiser, Hilux, RAV4 and Prius hybrid.

Toyota Land Cruiser Price in Pakistan 2025

Illustration 3: Toyota Land Cruiser is one of the most famous Toyota cars

The Toyota Motor Corporation owns several key brands:

  • Toyota (mainstream brand)
  • Lexus (luxury vehicles)
  • Daihatsu (compact cars and mini-vehicles)
  • Hino (commercial trucks and buses)

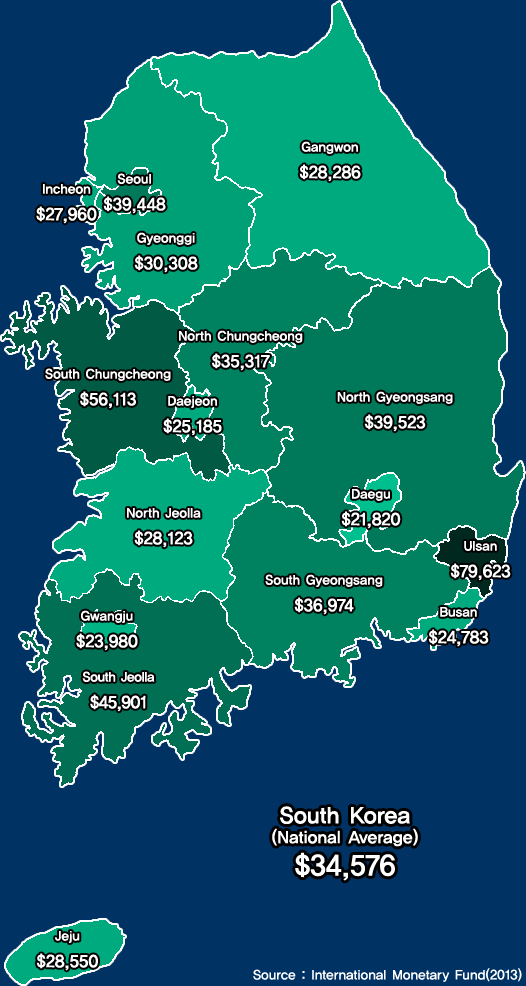
Toyota sells cars in all countries, but its biggest markets are asia and Japan.

Financial Highlights & Financial Performance | Shareholders & Investors  News | Toyota Motor Corporation Official Global Website

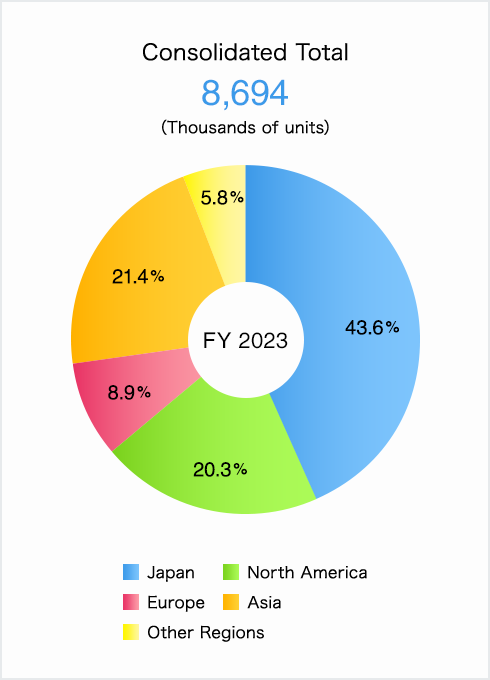
Illustration 4: Illustration of the biggest markets of Toyota


  • Electric and Hybrid Cars

Toyota has been a pioneer in hybrid technology since the launch of the Prius in 1997, the world’s first mass-produced hybrid electric vehicle. This bold move not only positioned Toyota as a technological leader but also sparked a global movement toward cleaner and more fuel-efficient vehicles. As of today, Toyota has sold over 20 million hybrid vehicles worldwide, contributing significantly to global CO₂ emissions reduction in the transportation sector.

Toyota’s hybrid portfolio is among the most comprehensive in the industry, spanning sedans, SUVs, and even commercial vehicles. Models like the RAV4 Hybrid, Corolla Hybrid, and Camry Hybrid continue to perform strongly in markets across Asia, North America, and Europe. Toyota is known for it’s longevity, quality and sustainability and it has proved that it can produce hybrid cars that are as solid as its gasoline cars.

Toyota teases slick electric sports cars in major EV preview - CNET

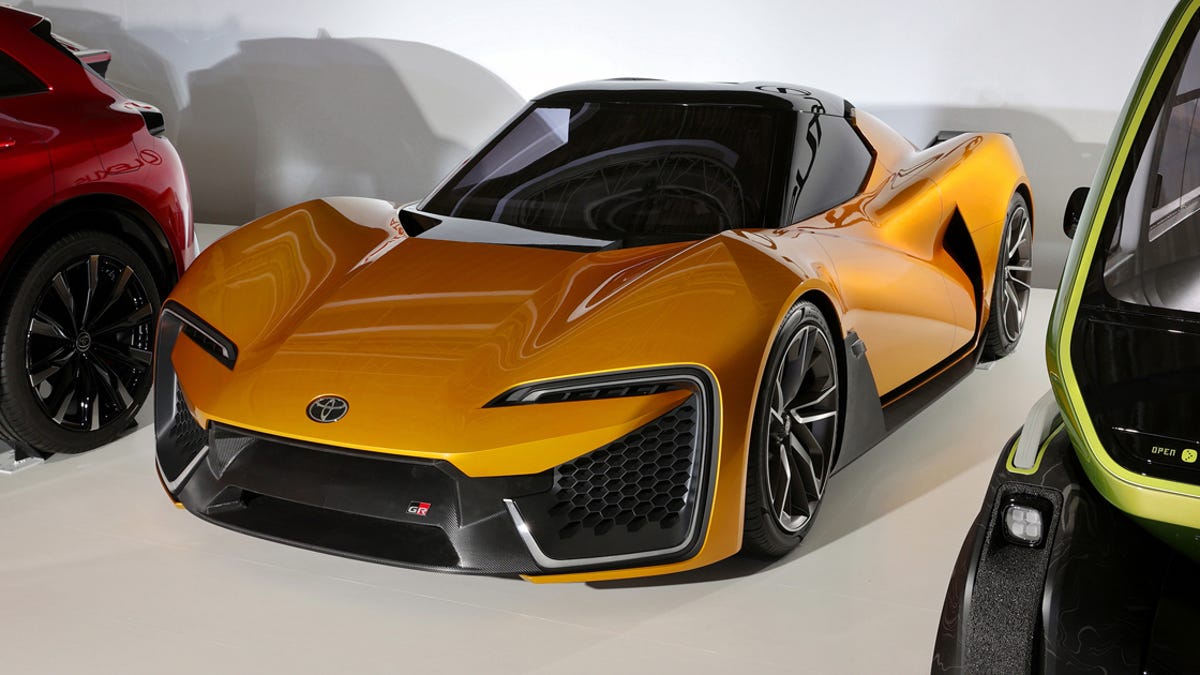
Illustration 5: Prototype of a new Toyota car that is to come out by 2026

In addition to hybrids, Toyota is expanding its presence in battery electric vehicles (BEVs). Under its new “bZ” (beyond zero) sub-brand, Toyota has launched the bZ4X, a fully electric crossover SUV, and plans to introduce over 10 new BEV models by 2026.

Toyota also produces hydrogen-powered cars as it intorduced Toyota Mirai, one of the few hydrogen-powered cars available to the public, in 2014. Toyota is also investing heavily in solid-state battery research. These next-generation batteries promise higher energy density, faster charging times and greater thermal stability, which could solve many of the limitations of current lithium-ion technology. Toyota aims to begin commercial production of solid-state batteries as early as 2027–2028, potentially reshaping the EV landscape.

  • Autonomous Driving, Robotics and AI

Under its innovation hub Woven by Toyota, the company is developing technologies for autonomous vehicles, smart cities, and connected mobility. Toyota’s Guardian system enhances driver safety through AI-driven assistive features, while its Chauffeur system aims for full autonomy in the future.

Toyota is also building Woven City, a fully connected smart city near Mt. Fuji to test smart infrastructure, robotics, and autonomous vehicles in real-life settings.

Beyond cars, Toyota is developing robotics for elderly care, manufacturing automation, and personal assistance. It has also invested in AI research, including partnerships with Stanford and MIT, and launched the Toyota Research Institute (TRI) to explore machine learning, robotics, and materials science.


Key Competitors

Toyota operates in one of the most competitive and rapidly evolving industries, facing rivals across traditional automaking, electric mobility, autonomous driving, and smart mobility ecosystems. Its competitors can be grouped into three main categories:

1. Traditional Global Automakers

  • Volkswagen Group: Toyota’s closest global rival by sales volume. Volkswagen has committed heavily to electrification, launching the ID. series of EVs and investing over €180 billion in digital and sustainable technologies. Its scale and global manufacturing footprint mirror Toyota’s, making the two firms frequent contenders in both developed and emerging markets.
  • General Motors (GM): Strong in North America and China, GM is transitioning aggressively to EVs under its Ultium battery platform and brands like Chevrolet, GMC, and Cadillac. GM’s Cruise division is also a key player in autonomous mobility.
  • Ford Motor Company: Ford competes in global markets, particularly in trucks, SUVs, and commercial vehicles. Its F-150 Lightning electric pickup and investment in self-driving (via Argo AI, now winding down) reflect its growing focus on innovation.
  • Honda: Fellow Japanese automaker and frequent rival in efficiency, reliability, and innovation.

2. Electrification and Mobility Disruptors

  • Tesla: As the world’s leading electric vehicle manufacturer, Tesla has redefined customer expectations in EV range, software, and direct-to-consumer sales. While Toyota is far ahead in hybrids and hydrogen, Tesla currently leads in BEV market share and autonomous software development.
  • BYD: China’s largest EV maker, BYD has quickly become a dominant force in battery-electric and plug-in hybrid vehicles. With vertical integration of battery and semiconductor manufacturing, BYD poses a strong challenge to Toyota’s market position in Asia and Latin America.
  • Hyundai-Kia: Rapidly growing with vehicles like the Ioniq 5 and EV6, the Hyundai Motor Group also invests heavily in hydrogen fuel cells, autonomous driving (via Motional), and design innovation. Hyundai’s ambition and product breadth increasingly rival Toyota’s.
Toyota reveals global sales in the first half increased 5.1% to 4.9 million  vehicles - Money & Banking Magazine

Illustration 6: A Toyota dealership


3. Tech Giants and AI Innovators

  • Apple and Google (Alphabet): Though not automakers per se, both companies are developing autonomous driving software and in-vehicle infotainment platforms. Google’s Waymo and Apple’s rumored “Apple Car” project symbolize the convergence of automotive and digital ecosystems.
  • NIO, XPeng, and Li Auto: Chinese EV startups are innovating rapidly in autonomous driving, digital UX, and direct sales models, supported by China’s strong EV policies.

Competitive Advantage

Toyota’s most defining advantage lies in its lean manufacturing and Kaizen culture. This system allows Toyota to produce high-quality vehicles with minimal waste and exceptional efficiency—offering a competitive edge in both cost control and scalability.

Its early leadership in hybrid technology has given Toyota unmatched experience in powertrain integration and fuel efficiency. Toyota’s scale, supply chain mastery, and reputation for reliability allow it to produce high-quality vehicles at competitive prices.

Rather than focusing solely on battery electric vehicles, Toyota has embraced a diverse electrification roadmap: hybrids, plug-in hybrids, BEVs, and hydrogen fuel cell vehicles. This approach gives Toyota flexibility across different markets and infrastructures, particularly in countries where charging infrastructure is underdeveloped.

Toyota is consistently ranked among the top brands for quality, safety, and long-term dependability. Its vehicles often command premium resale value and customer loyalty, helping sustain market share in competitive regions. Toyota invests heavily in R&D (over ¥1.2 trillion annually), with a focus on AI, robotics, connected mobility, and next-generation batteries. Its internal ventures like the Toyota Research Institute (TRI) and Woven by Toyota exemplify its commitment to transforming from a carmaker into a mobility technology company

2010 Toyota Prius Pricing, Photos & Specs

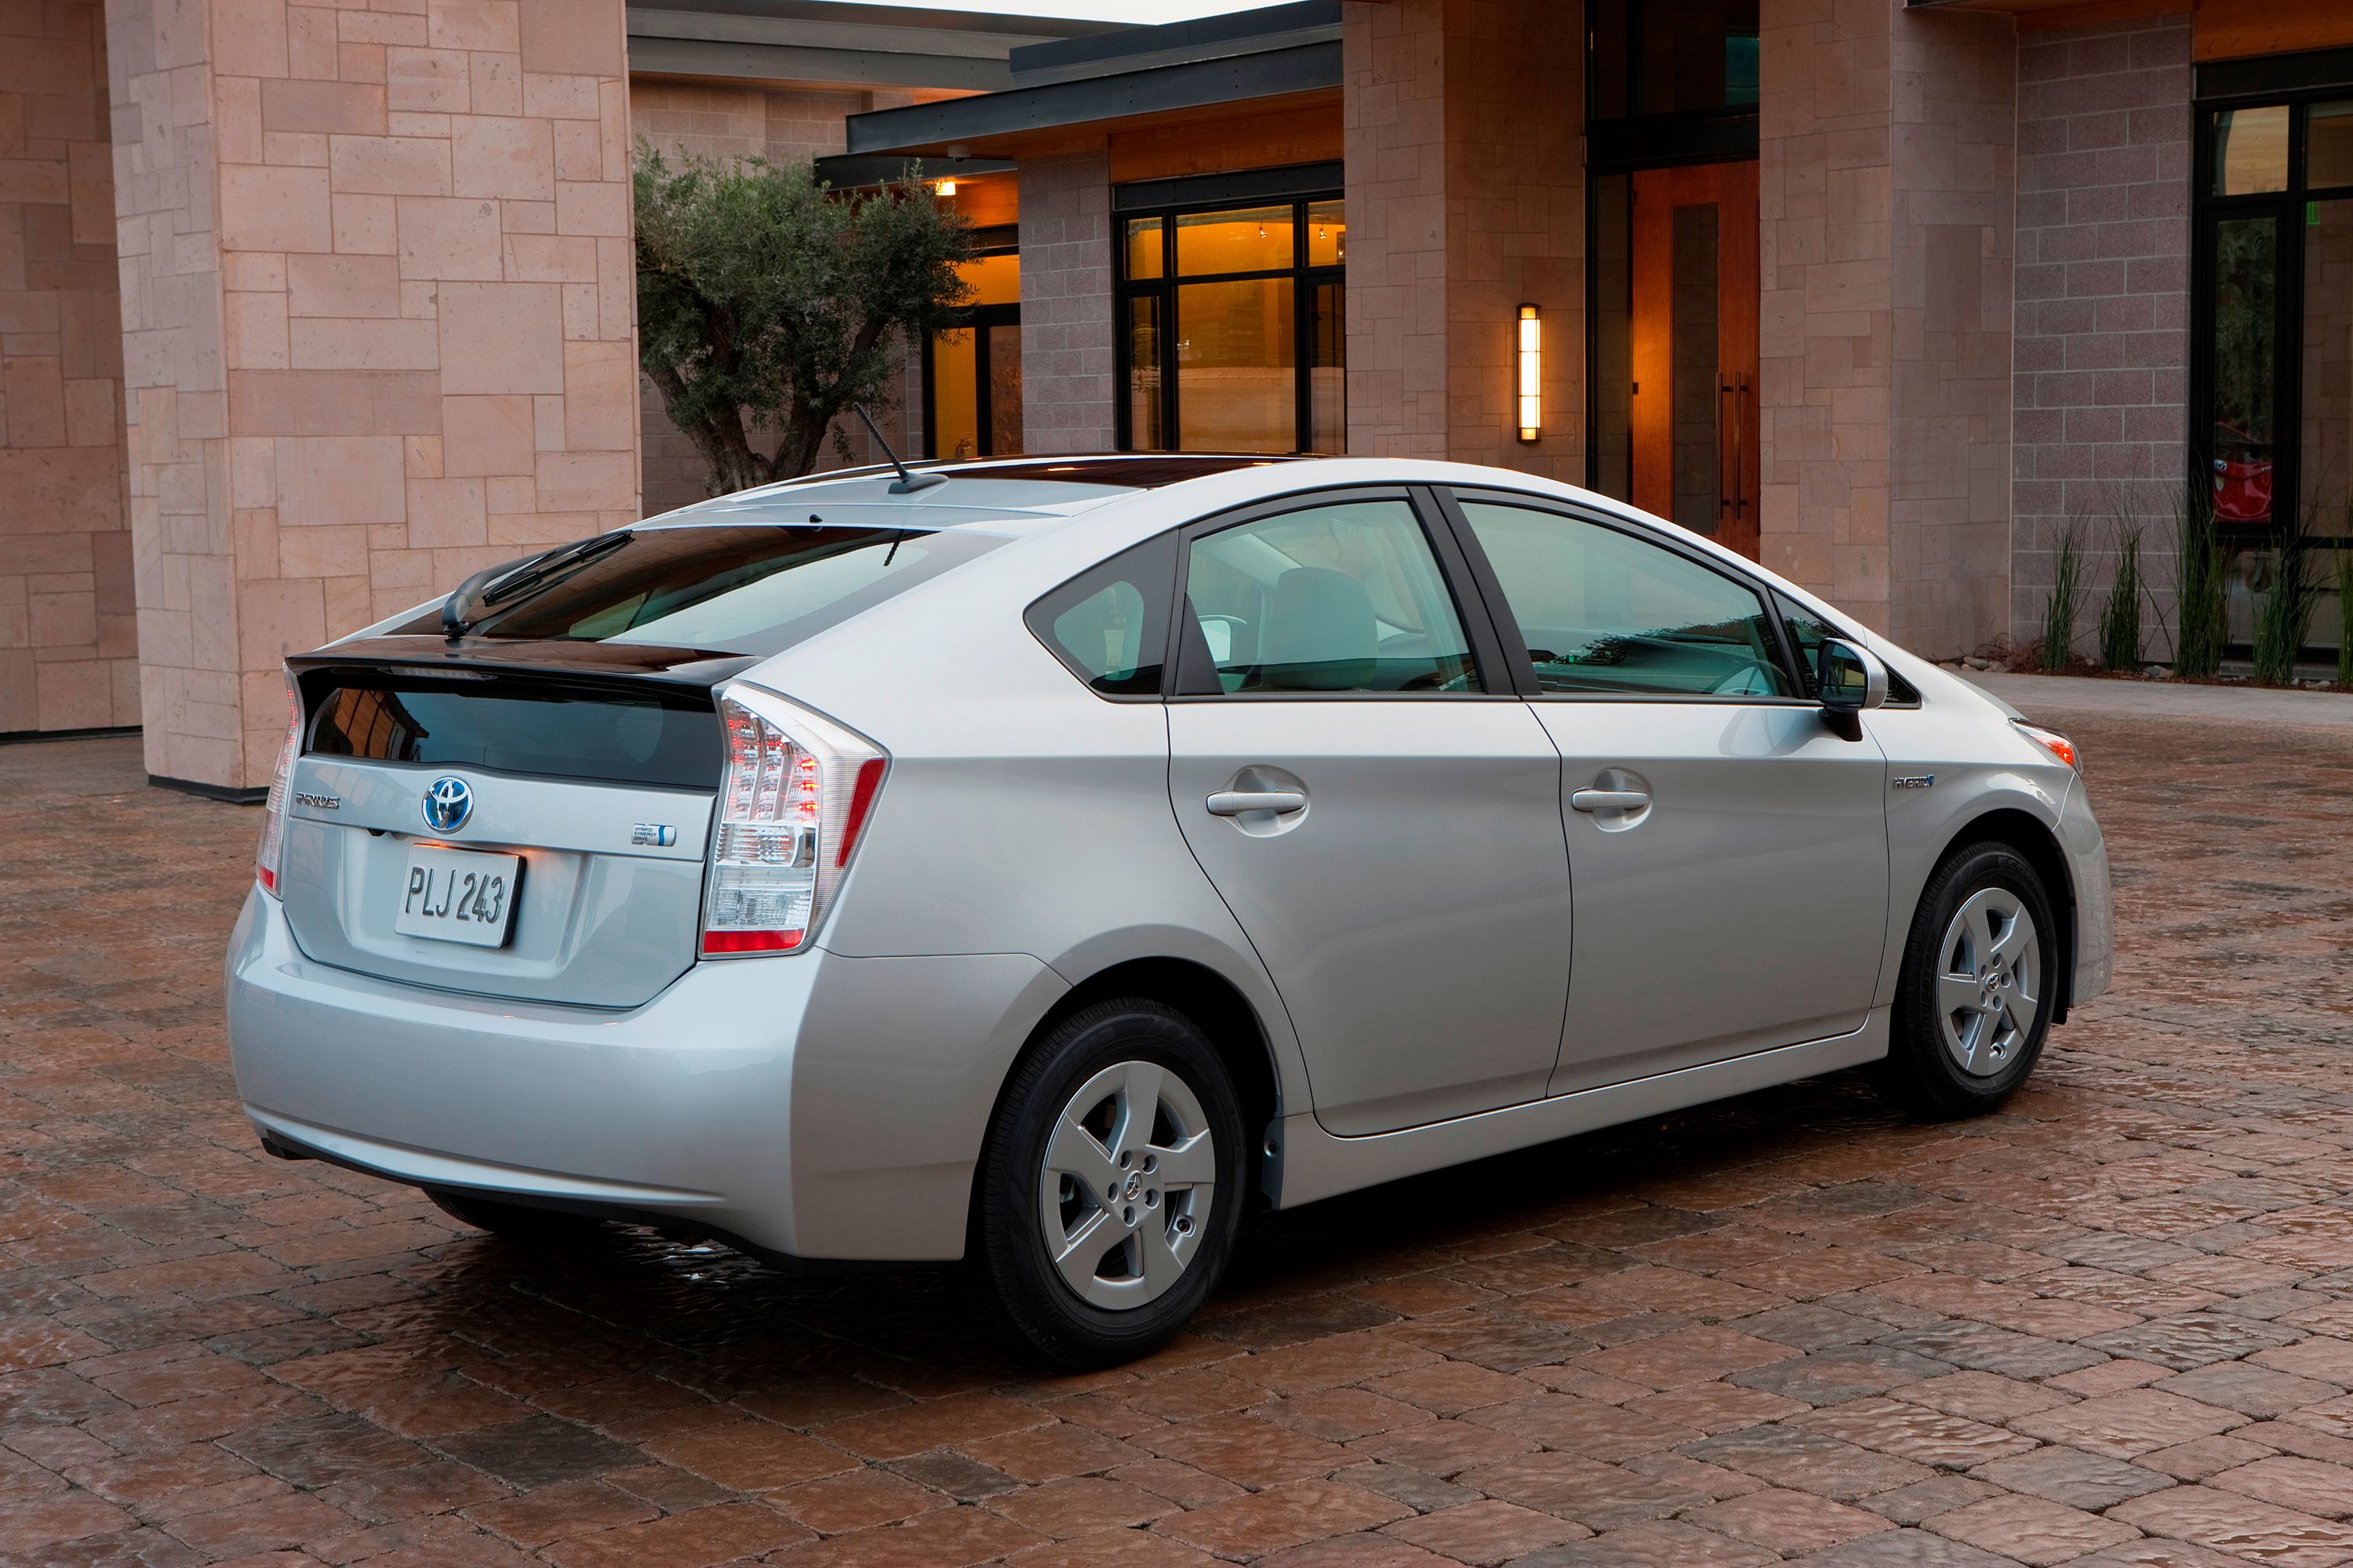
Illustration 7: Toyota Prius is a pioneer when it comes to hybrid cars

Future Outlook

Toyota is at a pivotal moment as the global auto industry transitions to electrification, autonomy and digital mobility. The company aims to sell 3.5 million battery electric vehicles annually by 2030, alongside continued leadership in hybrids and hydrogen.

Its investments in solid-state batteries, next-gen EV platforms and smart cities indicate a long-term strategy rooted in technological leadership and environmental responsibility.

As governments tighten emissions regulations and consumers demand cleaner, smarter mobility solutions, Toyota’s hybrid legacy, global reach, and evolving tech ecosystem position it as a mobility leader for the 21st century.


Stock Analaysis

In this section we will analyze Toyota’s stock to see if it is a good stock to buy or not. Our philosophy is value investing meaning that we try to find good quality companies that are undervalued. However, we will give a holistic overview so all kind of investors with different philosophies can judge the stock for themselves.

Revenue and Profits

Illustration 8 and 9: Revenue of Toyota Motor Corporation from 2009 to 2025

As shown in Illustrations 6 and 7, Toyota has maintained steady and consistent revenue growth from around USD 209 billion in 2009 to around 317 billion in 2025, without major spikes or declines. This smooth upward trajectory is a strong green flag, reflecting Toyota’s disciplined operations, global market balance, and long-term strategy.

Even through global disruptions like COVID-19 and supply chain challenges, Toyota’s lean manufacturing and diversified product mix helped it maintain growth. Its cautious but forward-looking investments in hybrids, EVs, hydrogen, and smart mobility have supported revenue expansion without volatility.

Overall, Toyota’s financial performance is a green flag for value investors as it shows a company that is stable, has increased its revenue steadily over time and been able to grow and handle crisis.

Illustration 10 and 11: Net Income of Toyota Motor Corporation from 2009 to 2025

Net income is a crucial metric to evaluate when determining whether a company is a worthwhile investment. It represents a company’s net profit or loss after accounting for all revenues, income items, and expenses, calculated as Net Income = Revenue – Expenses.

As seen in Illustrations 10 and 11, Toyota’s net income has followed a stable and upward trend from 2009 to 2025, closely mirroring its consistent revenue growth. Unlike many global automakers or tech firms, Toyota has avoided major profit volatility, thanks to its efficient cost structure, strong global demand, and disciplined investment strategy. This alignment between revenue and net income is a strong green flag, reflecting Toyota’s ability to innovate while maintaining healthy margins and financial stability.

Revenue Breakdown

Unveiling Toyota Motor (TM)'s Value: Is It Really Priced Right? A  Comprehensive Guide

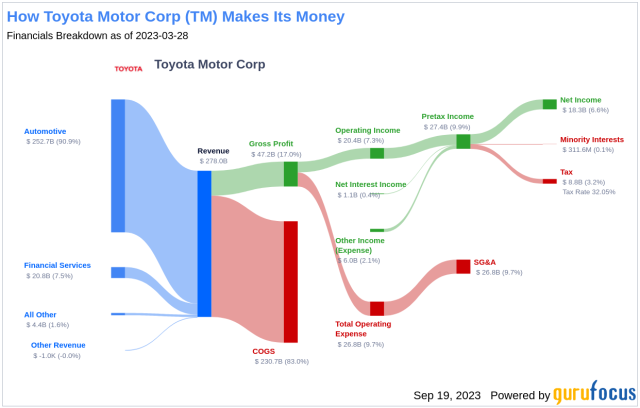
Illustration 12: Revenue breakdown for Toyota Motor Corp. made by guru focus

As shown in Illustration 12, Toyota’s core automotive operations remain its largest revenue driver, consistently contributing over 90% of total revenue. This includes sales of passenger vehicles, commercial trucks, and parts across global markets. Toyota’s diverse portfolio, from the Toyota Corolla and RAV4 to Lexus luxury models and Hilux pickups, provides broad appeal across customer segments and regions. Its leadership in hybrid technology has been a key factor in sustaining strong vehicle demand and repeat sales.

In addition to vehicle sales, Toyota’s financial services segment, offering leasing, loans, and insurance, accounts for approximately 7.5% of total revenue. This arm supports the company’s retail strategy by providing in-house financing for customers and dealers in major markets like the U.S., Europe, and Japan. It also generates stable recurring income, even during periods of lower vehicle sales.

Emerging technologies and mobility initiatives, including hydrogen fuel cell systems, battery electric vehicles (BEVs), autonomous driving (via Woven by Toyota), and AI-powered mobility platforms, contribute a small but growing portion of revenue, currently estimated at 1.6%. While not yet significant in financial terms, these areas are central to Toyota’s long-term transformation strategy and have seen growing R&D allocation.

Toyota’s heavy investment in R&D, consistently around 8–9% of revenue, supports innovation in electrification, AI, robotics, and autonomous driving. While these initiatives contribute to short-term cost pressure, they are considered essential for maintaining technological leadership and complying with future regulatory standards.

In terms of profitability, Toyota maintains strong gross margins across its core business due to operational efficiency, economies of scale, and its renowned Toyota Production System (TPS). However, newer segments like BEVs and hydrogen mobility currently have higher development and production costs, which modestly impact overall margins as they scale.

Overall, Toyota’s revenue structure reflects both stability and forward-looking diversification. Its core business provides predictable cash flow, while its investments in next-generation mobility position the company for leadership in a rapidly evolving automotive landscape.

Earnings per Share

Illustration 13: Earnings per share for Toyota Motor Corp. from 2009 to 2025

Earnings Per Share (EPS) is a key financial metric that measures a company’s profitability on a per-share basis. It indicates how much profit a company generates for each outstanding share of its stock, and is used to assess a company’s financial health, profitability, and potential for growth. In other words this metric can tell us how profitable the business is.

The EPS figure itself isn’t the primary focus for value investors, it can be 0.2 or 10, but what truly matters is the company’s ability to generate consistent earnings growth. A steadily increasing EPS over time signals strong financial health, profitability, and long-term value creation.

Toyota’s earnings per share from 2009 to 2025 shows an increase over time from -2.88 in 2009 to 23.73 in 2025. This reflects a remarkable turnaround and long-term financial strength, driven by consistent global demand, operational efficiency through the Toyota Production System, and strategic investments in hybrid and next-generation mobility technologies. The steady growth in EPS highlights Toyota’s ability to generate sustainable profits even amid industry disruptions, regulatory changes, and rising R&D spending, positioning it as one of the most resilient and reliable companies in the global automotive sector and is a green flag for investors.

Assets and Liabilities

Illustration 14 and 15: Assets and Liabilities for Toyota from 2009 to 2025

When evaluating a company as a potential investment, understanding its assets and liabilities is crucial. If a local business owner offered to sell their shop to you, one of the first questions. after determining its profitability, would be about its equity and assets. The same principle applies when assessing publicly traded companies like Toyota.

As shown in Illustrations 14 and 15, Toyota has built a substantial asset base, totaling approximately $621 billion in 2024. This steady asset growth from 2009 to 2024 is a strong positive indicator, reflecting the company’s ongoing expansion, long-term investments in electrification, autonomous technology, and manufacturing infrastructure.

At the same time, Toyota’s total liabilities have also increased over the years, rising from approximately $193 billion in 2009 to over $378 billion in 2024. While this rise in liabilities may raise concerns for some investors, it is not necessarily a red flag, as much of it is tied to Toyota’s financial services arm and ongoing investments in electrification, autonomous driving, and next-generation mobility infrastructure. These capital-intensive areas are critical for maintaining Toyota’s global competitiveness and future readiness. Historically, Toyota has maintained a strong balance between investment and financial discipline, supported by robust cash flows and consistent profitability. Nevertheless, the scale of its liabilities warrants continued observation. Investors should monitor Toyota’s ability to manage debt responsibly, ensuring that it does not limit strategic flexibility or affect long-term financial stability as the automotive industry continues to evolve.

The key factor for investors is whether Toyota can effectively manage its debt while maintaining strong revenue and profitability. If the company can generate consistent cash flow and sustain high demand for its products and services, its rising liabilities may not be a major issue. However, if debt levels continue to grow faster than revenue or profits, it could indicate financial strain, making it important for investors to monitor the company’s ability to service its obligations while maintaining profitability.

Toyota’s cash on hand in 2024 is notably less than its long-term debt, which raises some concerns about its liquidity position. Holding less readily available cash compared to its debt obligations may indicate potential challenges in meeting short-term financial commitments without relying on additional financing or asset sales. This imbalance could limit Toyota’s flexibility to fund strategic investments or navigate unexpected market downturns, and investors should monitor the company’s cash flow management closely to assess any risks related to its financial stability. This should be monitored closely by all investors.

As seen in Illustration 15, Total Shareholder Equity, calculated as total assets minus total liabilities, has consistently grown over the past 14 years. This is a positive indicator for potential investors, as it suggests that Toyota is building value over time rather than eroding its financial foundation. A steadily increasing shareholder equity indicates that the company’s assets are growing at a faster rate than its liabilities, which is a green flag for financial health. This trend suggests that Toyota is successfully expanding its operations while maintaining a solid balance sheet. Additionally, rising equity provides a buffer against financial downturns, making the company more resilient in times of economic uncertainty. However, investors should also consider how this growth is achieved, whether through profitable operations or increased debt financing, to fully assess the sustainability of this trend.

Debt to Equity Ratio

Illustration 16 and 17: Debt to Equity ratio for Toyota Motor Corp. from 2009 to 2024

The Debt-to-Equity (D/E) ratio is an important financial metric for assessing a company’s financial leverage and risk. It compares the amount of debt the company uses to finance its operations relative to its shareholder equity. A high D/E ratio suggests that the company relies more heavily on debt to fuel growth, which could increase financial risk, especially during economic downturns when managing debt obligations becomes more challenging. In contrast, a lower D/E ratio indicates that the company is primarily financed through equity, reducing financial risk but potentially limiting its ability to rapidly expand.

Legendary value investor Warren Buffett generally prefers a debt-to-equity (D/E) ratio below 0.5. Toyota’s D/E ratio, however, stood at approximately 1.57 in 2024. TWhile this could raise concerns about Toyota’s financial leverage and its capacity to manage debt—especially amid industry shifts and economic uncertainties, it is not necessarily a red flag. Toyota has been strategically using debt to fund key investments in electrification, hydrogen technology, and autonomous systems, supporting its long-term growth ambitions. The downwards trend in D/E ratio is also a positive sign for investors as it indicates less reliance on debt financing over the years.

Price to earning ratio (P/E)

Illustration 18 and 19: Price to earnings ratio of Toyota Motor Corp. from 2010 to 2025

For value investors, one of the most critical metrics when evaluating Toyota’s stock is the price-to-earnings (P/E) ratio, as it helps assess whether the company is undervalued or overvalued. Even if a company has strong financials, purchasing its stock at a high price can lead to poor returns. For example, imagine a business generating solid profits of $1 million per year. If the owner offers to sell you the business for just $1, it would be an incredible deal. But if the owner asks for $1 trillion, even though the business is profitable, the price would be absurdly overvalued. The stock market works similarly, companies can be priced cheaply on some days and excessively expensive on others.

Warren Buffett, a legendary value investor, typically considers stocks with a P/E ratio of 15 or lower as “bargains.” A high P/E ratio suggests that investors are paying a premium for the company’s earnings, expecting significant growth. Toyota Motor Corporation has consistently maintained a relatively low P/E ratio over the years, hovering around 10 across multiple periods, as can be seen in illustration 18. This consistent valuation suggests a cautious but stable investor outlook, reflecting Toyota’s mature industry position and steady earnings performance. The current P/E ratio of 10.2 may signal that Toyota remains undervalued relative to the broader market. For value investors, this steady undervaluation could present an appealing entry point, especially if Toyota continues to perform reliably while transitioning to electric and autonomous vehicle technologies.

Price to Book ratio (P/B)

Illustration 20 and 21: Price to book ratio for Toyota Motor Corp. from 2009 to 2024

Price-to-book value (P/B ratio) is a financial metric used to compare a company’s market value (its stock price) to its book value (the net asset value of the company, calculated as total assets minus total liabilities). The P/B ratio is calculated by dividing the current share price by the book value per share. A lower P/B ratio suggests that the stock may be undervalued, as investors are paying less for the company’s assets than their actual worth. Conversely, a high P/B ratiomay indicate that the stock is overvalued, or that investors expect high growth in the company’s future earnings. The P/B ratio is often used by value investors to assess whether a stock is trading at a fair price based on its underlying assets. Legendary Investor Warren Buffet prefers company’s with P/B lower than 1.5 and often buys around 1.3 or lower.

The price-to-book (P/B) ratio of Toyota Motor Corporation is a green flag for value-oriented investors, as it has remained consistently low compared to industry peers and well within the range Warren Buffett often considers attractive. With a P/B ratio typically hovering around 1.0 or lower in recent years, Toyota appears undervalued relative to the net worth of its assets. This suggests that investors are paying a modest price for ownership in a company with strong tangible asset backing, healthy cash flows, and a proven global presence. Unlike tech companies with inflated P/B ratios driven by future growth speculation, Toyota’s low P/B reflects its stable earnings, conservative balance sheet, and disciplined capital allocation. For value investors, this consistency signals a potentially underappreciated opportunity, especially as Toyota ramps up its transition to electric and hydrogen vehicles, which could unlock new growth while maintaining financial resilience. Rather than indicating market pessimism, Toyota’s low valuation may simply reflect a longstanding investor tendency to undervalue traditional automakers, offering a chance for upside if the market re-rates its future prospects.

Return on Investment (ROI)

Illustration 22 and 23: Return on Investment for Toyota Motor Corp. from 2010 to 2015

For value investors, another essential metric when evaluating Toyota’s stock is Return on Investment (ROI), as it reveals how efficiently the company is using its capital to generate profits. In simple terms, ROI measures how much return a business earns relative to the capital invested to run it. Even if a company shows strong revenues, if it needs massive amounts of capital to produce modest profits, it may not be an attractive investment. For example, if one company generates a $100,000 return on a $1 million investment, while another earns the same return on just $500,000, the latter is clearly more efficient and potentially more valuable. ROI helps investors identify these distinctions and avoid companies that consume capital without delivering proportional returns. The higher the ROI, the better but it is also very industry dependent as some industries need a lot more capital than others. Legendary investor Warren Buffett has often stated that he seeks returns of at least 15% annually on his investments over time. While he doesn’t quote ROI specifically, this is effectively what he aims for in terms of return on invested capital and intrinsic value growth.

Toyota Motor Corporation has historically delivered a low but stable ROI, often ranging between 5% and 10%, which is considered healthy for a capital-intensive industry like automotive manufacturing. Even though, this is under Buffet’s expectations this is a normal ROI in the automaker industry which is very capital intensive. This consistent performance indicates that Toyota is effectively deploying its resources to generate returns, especially in comparison to peers in the same sector who may struggle with slimmer margins or capital inefficiency. As shown in illustration 21, Toyota’s ability to maintain solid ROI over time. despite economic cycles, supply chain disruptions, and shifts in consumer demand, demonstrates sound management and operational resilience. For long-term investors, this level of capital efficiency is a green flag, suggesting that Toyota is not just a stable company but one that continues to deliver meaningful returns without reckless spending, even as it invests in the future of mobility through electrification and automation.

Dividend

Illustration 24: Dividend Yield and dividend payout ratio from 2005 to 2025.

Toyota Motor Corporation has established itself as a reliable dividend payer in the global automotive industry, offering an annual dividend of approximately ¥60–¥70 per share in recent years. This reflects the company’s commitment to rewarding shareholders while maintaining financial discipline. Toyota’s steady dividend history—even through economic downturns—underscores its reputation as a financially stable, conservative company, making it a favorable choice for income-seeking investors.

However, there are considerations regarding Toyota’s dividend yield, which typically ranges between 2% and 3%. While the company continues to return capital to shareholders, growing demands for investment in electrification, autonomous driving, and sustainability initiatives could limit the pace of future dividend increases. As Toyota ramps up R&D and capital expenditures to stay competitive in a rapidly evolving industry, sustained dividend growth may face some headwinds if earnings growth slows.

Insider Trading

As a Foreign Private Issuer (FPI), Toyota is not required to file insider trading reports with the U.S. Securities and Exchange Commission (SEC). However, the company provides detailed disclosures in its annual reports and Form 20-F filings, which include information on executive compensation, shareholdings, and related party transactions.

Over the past years, Toyota Motor Corporation has not reported direct insider transactions involving its own shares. According to publicly available data and insider-tracking sources, the most recent direct insider transactions involving Toyota Motor Corporation’s own stock (NYSE: TM) date back to 2004.

This can be seen as both a red and a green flag for potential investors. It is a green flag as The absence of insider sales may suggest that Toyota’s executives have long-term confidence in the company and see no reason to cash out. Unlike many public firms where executives frequently sell stock, Toyota’s leadership appears more focused on stewardship than on short-term financial gains. Furthermore, In Japan, corporate culture traditionally emphasizes stability, loyalty, and modest compensation. Executives are less incentivized through stock grants compared to U.S. firms. This can reflect a conservative, shareholder-friendly philosophy where management is aligned with long-term success rather than short-term speculation.

However, The absence of insider purchases—even during market dips—may raise eyebrows. If executives truly believed the stock was undervalued at any point, why didn’t they buy? In the U.S., insider buying is often considered a strong bullish signal. Toyota is a Japanese company listed as an ADR (American Depositary Receipt) in the U.S., and insider trading disclosures aren’t held to the same real-time standards as in the U.S. This can lead to lower visibility and slower access to critical insider activity data, which some investors view as a governance downside. Toyota’s executive compensation is less tied to equity than U.S. firms, meaning insiders may not have “skin in the game” to the same extent. For some investors, this reduces alignment between management and shareholders.

Other Company Info

Founded in 1937, Toyota Motor Corporation is one of the world’s largest and most respected automotive manufacturers, known for its high quality and sustainable vehicles. As of 2024, Toyota employs approximately 375,000 people globally, reflecting its extensive operations in manufacturing, R&D, and mobility solutions. The company is publicly traded on the Tokyo Stock Exchange (TSE) under the ticker symbol 7203 which is its main listing, but it is also cross -listed on the New York Stock Exchange under the ticker symbol TM and operates within the Consumer Discretionary sector, specifically in the Automobiles industry.

Toyota is headquartered at 1 Toyota-cho, Toyota City, Aichi Prefecture, Japan. As of 2024, the company has approximately 3.2 billion shares outstanding, with a market capitalization of over $300 billion USD. For more information, visit Toyota’s official website: https://global.toyota.

Final Verdict

Toyota Motor Corporation is a solid long-term investment, especially for value and income investors. With consistently low P/E and P/B ratios, the stock appears undervalued compared to its history and peers. Toyota has a strong balance sheet, steady dividends, and a conservative payout ratio, making it reliable for income seekers.

The company is investing in hybrids, electric vehicles, hydrogen fuel cells, and autonomous driving, maintaining its global leadership with operations in over 170 countries. Although Toyota’s EV transition is slower than some competitors, its diversified approach could offer stability.

Overall, Toyota looks like a great opportunity for value investors. It seems undervalued, has solid financials and offers steady growth nad reliable dividends, making it an attractive choice for long-term investors focused on stability rather than rapid growth.

The South Korean Economy: A Story of Remarkable Transformation and Resilience

South Korea, officially known as the Republic of Korea (ROK), presents an intriguing case study in economic development. From the ravages of the Korean War to becoming an economic powerhouse, the South Korean economy’s journey is a testament to a combination of strategic planning, relentless hard work, and innovative spirit.

From its humble beginning the countries economy had grown to a nominal GDP of ₩2.24 quadrillion (US$1.72 trillion) making it the 4th largest economy in Asia and the 12th largest in the world

Part of the OECD and the G20. South Korea’s education system and an educated and motivated population was largely responsible for the technology boom and economic development in the country. South Korea adapted an export-oriented economic strategy to fuel its economy. In 2019, South Korea was the eight largest exporter and eight largest importer in the world.

Financial organizations, such as the international monetary fund comments that the South Korean economy is resilient against various economic crises. They country’s economic advantages such as its low state debt, and high fiscal reserves and its country’s major economic output being the technology products exports is the reason behind this resilience.

However, despite the South Korean economy’s high growth and structural stability, the credit rating of the country is damaged in the stock market due to North Korea in times of military crisis. The recurring conflict affects the financial markets of its economy

The Beginning

The foundation of the South Korean economic story is deeply rooted in its tumultuous history. After gaining independence from Japan in 1945, Korea was split into North and South. The Korean War (1950-1953) devastated the South Korean economy, leaving it as one of the poorest countries in the world.

However, South Korea only remained a country with less developed markets for a little more than a decade after the Korean war.


The principal reason behind the growth of the South Korea’s economic development is the industrial sector. Due to strong domestic encouragement and some foreign aid, Seoul’s industrialists introduced modern technologies into outmoded or newly built facilities, increased the production of commodities especially those for sale in foreign markets and invested the proceeds back into further industrial expansion. As a result, industry altered South Korea’s landscape, drawing millions of labourers to urban manufacturing centres.

The Miracle on the Han River

In the beginning in the 1960s, under the leadership of Park Chung-hee, South Korea underwent rapid industrialization and modernization, an era often referred to as the “Miracle on the Han River.”

The government instituted comprehensive reforms and laid the groundwork for an export-driven economy. To promote development, a policy of export oriented industrialization was applied, closing the entry into the country of all kinds of foreign products, except raw materials. Major industries, such as steel, shipbuilding, and chemicals, were heavily promoted. Infrastructure, education, and R&D became vital investment areas.

The 1970s and 1980s saw the rise of family-controlled conglomerates, or “chaebols,” like Samsung, Hyundai, and LG. Their growth was often backed by government policies, and they became significant players in driving South Korea’s economic expansion.

Through the model of export-led industrialization, the government incentigvized corporations to develop new technology and upgrade productive efficiency to compete the global market. By adhering to state regulations and demands, firms were awarded subsidization and investment support to develop their export markets in the evolving international arena. The chaebols received state incentives such as tax breaks, legality for their exploitation system and cheap or free financing In addition, the inflow of foreign capital was encouraged to supplement the shortage of domestic savings. These efforts enabled South Korea to achieve growth in exports and subsequent increases in income.

By emphasizing the industrial sector, Seoul’s export-oriented development strategy left the rural sector barely touched. The steel and shipbuilding industries in particular played key roles in developing South Korea’s economy during this time.

The Asian financial crisis and its aftermath


In 1997, South Korea, along with many Asian nations, faced a severe financial crisis. The chaebols’ excessive borrowing and a fixed exchange rate regime were among the primary reasons for South Korea’s vulnerability. The crisis led to significant economic restructuring, with the International Monetary Fund (IMF) providing a $58 billion bailout package.

Hosting the 1988 Summer Olympic Games, commonly known as Seoul 1988, provided the country with the momentum to join the ranks of semi-advanced countries. The overseas mass media called South Korea one of the four Asian tigers along with Taiwan, Singapore, and Hong Kong. In December 1996, the country became the 29th member country of the OECD, which is largely composed of advanced countries.

In response, the South Korean government implemented stringent reforms, including financial sector liberalization, corporate governance reforms, and the restructuring of chaebols. By 2001, the country had remarkably bounced back, with its economy growing at 4%.

High-tech industries in the 1990s and 2000s

In 1990, South Korean manufacturers planned a shift in future production toward high-technology industries. In June 1989, panels of government officials, scholars, and business leaders held planning sessions on the production of such goods as new materials, mechatronics, bioengineering, microelectronics, fine chemistry, and aerospace.

This shift did not mean an immediate decline in heavy industries such as automobile and ship production, which had dominated the economy in the 1980s.

In November 1997, a foreign exchange crisis hit the country, forcing it to turn to the IMF for a bailout. It was the first ordeal the country had to confront after years of rapid economic growth. The country took the drastic step to drive insolvent businesses out of the market and then pushed ahead with industrial restructuring. In only two years, the country regained its previous growth rate and price levels as well as a current account balance surplus. In the process, some 3.5 million people joined in the campaign to collect gold to help the government repay the fund borrowed from the IMF. A total of 227 tons of gold were collected. The world marveled at the South Koran people’s voluntary participation in the determined effort to repay its national debts

South Korea today is known as a Launchpad of a mature mobile market, where developers thrive in a market where few technology constraints exist. There is a growing trend of inventions of new types of media or apps, using the 4G and 5G internet infrastructure in South Korea. South Korea has today the infrastructures to meet a density of population and culture that has the capability to create strong local particularity. The country has displayed global competitiveness in various fields such as mobile phones, semiconductors, automobiles, chemicals, and steelmaking. In recent years, its cultural content, including music, gaming, and webtoons, is emerging as an essential industry in itself, taking the lead in the Korean economy.


The chaebols are large family-owned business conglomerates that dominate South Korea’s economic, political, and social life. Their roots trace back to the 1960s and 70s when South Korea, under the leadership of then-president Park Chung-hee, embarked on an ambitious plan of industrialization. The government formed strategic partnerships with select business groups, offering them financial incentives, cheap loans, and protection from competition in exchange for their commitment to the national industrialization effort.

At the heart of every chaebol is a founding family. The typical culture at one of these conglomerates is highly paternalistic. Much of the environment is defined by the chairman who acts as a “fatherly figure” to his subordinates. Workers commit to long hours, most notably on weekends and holidays, to appease their superiors. Company outings and drinking sessions tend to be compulsory to foster a sense of family and belonging among employees. Employers believe that enhancing a common bond between them would translate into prosperity and productivity for the company. Other practices that would be uncommon for Western workplaces to engage in include gift-giving to employees and arranging dates for workers in search of relationships or marriage.

Chaebols are notoriously hierarchical. As such, it is unusual for an individual to challenge or question the decision-making of his or her boss. Promotion is rarely merit-based. Rather, it is through the order of age and time served to the conglomerate. If a worker does not attain an executive or senior-management role by the age of fifty, he or she is commonly forced to resign.

Because of South Korea’s long-lasting relationship with chaebols, South Korea has always suppressed and ignored labour unions. As of 2019, there are only two legally recognized labour unions in South Korea: The Federation of Korean Trade Unions and the Korean Confederation of Trade Unions. Despite these unions’ attempts at reform, the South Korean government does not take many actions. If a union oversteps and openly criticizes a chaebol, it faces serious repercussions, as chaebols are essentially government entities. It is well known that chaebols evade taxes regularly.  

Many South Korean family-run chaebols have been criticized for low dividend payouts and other governance practices that favor controlling shareholders at the expense of ordinary investors. Because of their major role in the Korean stock market, foreign investors play a massive part in whether or not chaebol conglomerates remain financially successful.

Foreign investors tend to avoid chaebols, especially those that displayed heavy political influence in South Korea, like Samsung and Hyundai. Investors are reluctant to invest in large control-ownership disparity businesses because these companies tended to cheat shareholders to have higher personal financial gain. A study published in the Journal of the Japanese and International Economies found that after the 1997 Asian financial crisis, foreign investment behavioural patterns changed drastically. While foreign investors like to hold shares in large companies with high profit and liquidity margins, they do not show any particular interest in either chaebol or non-chaebol companies. Nonetheless, chaebols are still able to survive, highlighting just how much power and aid they receive from the Korean government. All but 3 of the top 50 firms listed on the Korean Stock Exchange are designated as chaebols, and despite chaebols only accounting for just over 10 percent of the country’s workers, the four largest chaebols hold 70 percent of total market capitalization, and all chaebols together holding 77 percent as of the late 2010s.

Even though they might hold a minor stake in terms of shares, they exercise considerable control through a complex web of cross-shareholdings among subsidiary companies. One of the characteristics of a Chaebols is diversification meaning have a diverse range of businesses. For instance, Samsung, initially a trading company, has expanded into electronics, shipbuilding, construction, insurance. Many chaebols are known for vertical integration. They often control the entire supply chain, from raw materials to finished products, ensuring reduced costs and greater markert.

While chaebols have been instrumental in South Korea’s economic success, they haven’t been without controversies. The power and wealth concentrated in a few chaebols have sometimes stymied the growth of small and medium-sized businesses. Due to their complex structures and family dominance, issues of corporate governance, transparency, and fair trade practices have been raised. Over the years, several chaebols have been embroiled in political scandals, raising concerns about their influence on political decisions. For many people the nut rage incident where Korean Air vice president Heather Cho dissatisfied with the way a flight attendant served nuts on the plane, ordered the aircraft to return to the gate before takeoff , highlights the power chaebols have.


Economic inequality, a universal challenge, has emerged as a focal point of discussion in South Korea, a nation renowned for its remarkable post-war economic transformation. While the “Miracle on the Han River” narrates a story of astounding growth, there’s a less talked about subplot – widening economic disparities.

South Korea was the 5th most equal country in the world in 2019, however economic inequality is growing. According to data from 2010, low-income earners (those earning 12 million won or less) make up 37.8% of South Korea’s labour force. However, among other countries in OECD, South Korea performs relatively well when considering indicators such as the Gini coefficient and Palma ratio, especially when limiting the comparison to countries with similar populations

Income disparity in South Korea has been growing. The top 10% of income earners in the country make around 45% more than the bottom 10%. The implications of this gap manifest in various ways, from access to quality education and healthcare to overall life satisfaction and social mobility.

Regional disparities also exists in South Korea. Seoul and its neighboring regions, being the epicenters of commerce and industry, have seen greater growth than other parts of the country, leading to noticeable regional economic imbalances.

Figure above shows regional disparities in South Korea.

There is a generation gap in South Korea. Young South Koreans, despite being more educated than previous generations, face challenges like underemployment, precarious job security, and rising housing costs. On the other hand, the elderly population, which has grown due to increased life expectancy, faces poverty rates that are alarmingly high by OECD standards. The social safety net in South Korea is less comprehensive than in many other developed nations. This has particularly affected the elderly population, leading to high levels of elderly poverty.

Real estate in South Korea, especially in Seoul, has seen skyrocketing prices, making homeownership an unattainable dream for many young people. Speculative investments in property have further exacerbated this issue. Economic inequality is often linked to low or limited social mobility, a situation which may instill a sense of hopelessness among South Korea’s youth. Gambling, though extremely limited due to its legality in South Korea, can be a dangerous source of debt for South Koreans who are susceptible to gambling and gambling addiction. In 2017, the availability of cryptocurrency in South Korea,combined with a lack of legal outlets for gambling, has contributed to gambling problems and associated deb

South Korea’s labor market is characterized by a divide between regular and non-regular workers. Non-regular workers, despite making up a substantial portion of the workforce, face lower wages, less job security, and fewer benefits.

Overall GDP by section can be summarized as agriculture: 2.2%industry: 39.3%services: 58.3%(2017 est.)

Shipbuilding

Shipbuilding-During the 1970s and 1980s, South Korea became a leading producer of ships, including oil supertankers, and oil-drilling platforms. The country’s major shipbuilder was Hyundai, which built a 1-million-ton capacity drydock at Ulsan in the mid-1970s. Daewoo joined the shipbuilding industry in 1980 and finished a 1.2-million-ton facility at Okpo on Geoje Island, south of Busan, in mid-1981.


The industry declined in the mid-1980s because of the oil glut and because of a worldwide recession. There was a sharp decrease in new orders in the late 1980s; new orders for 1988 totaled 3 million gross tons valued at US$1.9 billion, decreases from the previous year of 17.8 percent and 4.4 percent, respectively. These declines were caused by labor unrest, Seoul’s unwillingness to provide financial assistance, and Tokyo’s new low-interest export financing in support of Japanese shipbuilders. However, the South Korean shipping industry was expected to expand in the early 1990s because older ships in world fleets needed replacing. South Korea eventually became the world’s dominant shipbuilder with a 50.6% share of the global shipbuilding market as of 2008. Notable Korean shipbuilders are Hyundai Heavy Industries, Samsung Heavy Industries, Daewoo Shipbuilding & Marine Engineering, and the now bankrupt STX Offshore & Shipbuilding.

Electronics

Electronics is one of South Korea’s main industries. During the 1980s through the 2000s, South Korean companies such as Samsung, LG and SK led South Korea’s growth. In 2017, 17.1% of South Korea’s exports were semiconductors produced by Samsung Electronics and SK Hynix. Samsung and

LG are also major producers in electronic devices such as televisions, smartphones, display, and computers.

Automobiles

The automobile industry was one of South Korea’s major growth and export industries in the 1980s. By the late 1980s, the capacity of the South Korean motor industry had increased more than fivefold since 1984; it exceeded 1 million units in 1988. Total investment in car and car-component manufacturing was over US$3 billion in 1989. In 1988 automobile exports totaled 576,134 units, of which 480,119 units (83.3 percent) were sent to the United States.

Throughout most of the late 1980s, much of the growth of South Korea’s automobile industry was the result of a surge in exports; 1989 exports, however, declined 28.5 percent from 1988. This decline reflected sluggish car sales to the United States, especially at the less expensive end of the market, and labor strife at home. South Korea today has developed into one of the world’s largest automobile producers. The Hyundai Kia Automotive Group is South Korea’s largest automaker in terms of revenue, production units and worldwide presence.

Mining

Most of the mineral deposits in the Korean Peninsula are located in North Korea, with the South only possessing an abundance of tungsten and graphite. Coal, iron ore, and molybdenum are found in South Korea, but not in large quantities and mining operations are on a small scale. Much of South Korea’s minerals and ore are imported from other countries. Most South Korean coal is anthracite that is only used for heating homes and boilers.


In 2019, South Korea was the 3rd largest world producer of bismuth, the 4th largest world producer of rhenium, and the 10th largest world producer of sulfur.

Construction

Construction has been an important South Korean export industry since the early 1960s and remains a critical source of foreign currency and invisible export earnings. By 1981 overseas construction projects, most of them in the Middle East, accounted for 60 percent of the work undertaken by South Korean construction companies.

South Korean construction companies concentrated on the rapidly growing domestic market in the late 1980s. By 1989 there were signs of a revival of the overseas construction market: the Dong Ah Construction Company signed a US$5.3 billion contract with Libya to build the second phase of Libya’s Great Man-Made River Project, with a projected cost of US$27 billion when all 5 phases were completed. South Korean construction companies signed over US$7 billion of overseas contracts in 1989. Korea’s largest construction companies include Samsung C&T Corporation, which built some of the highest building’s and most noteworthy skyscrapers such as three consecutively world’s tallest buildings: Petronas Towers, Taipei 101, and Burj Khalifa.

Armaments

Since the 1980s, South Korea has begun exporting military equipment and technology to boost its international trade. South Korea also exports various core components of other countries’ advanced military hardware. Those hardware include modern aircraft such as F-15K fighters and AH-64 attack helicopters which will be used by Singapore. In other major outsourcing and joint-production deals, South Korea has jointly produced the S-300 air defense system of Russia via Samsung Group. South Korea’s defense exports were $1.03 billion in 2008 and $1.17 billion in 2009

Tourism

In 2012, 11.1 million foreign tourists visited South Korea, making it one of the most visited countries in the world, up from 8.5 million in 2010. Many tourists from all around Asia visit South Korea which has been due to the rise of Korean Wave (Hallyu).Seoul is the principal tourist destination for visitors; popular tourist destinations outside of Seoul include Seorak-san national park, the historic city of Gyeongju and semi-tropical Jeju Island.

Overall

South Korea relies upon exports to fuel the growth of its economy, with finished products such as electronics, textiles, ships, automobiles, and steel being some of its most important exports. Although the import market has liberalized in recent years, the agricultural market has remained protectionist due to disparities in the price of domestic agricultural products such as rice with the international market. As of 2005, the price of rice in South Korea was four times that of the average price of rice on the international market, and it was believed that opening the agricultural market would affect South Korean agricultural sector negatively. In late 2004, however, an agreement was reached with the WTO in which South Korean rice imports will gradually increase from 4% to 8% of consumption by 2014. In addition, up to 30% of imported rice will be made available directly to consumers by 2010, where previously imported rice was only used for processed foods. Following 2014, the South Korean rice market will be fully opened

South Korea established an export-oriented economic structure centered on large businesses while pursuing growth in the face of insufficient capital and resources. This led conglomerates to dominate industry, making the economic structure heavily reliant on exports and imports, thus leaving the country susceptible to external economic conditions.

Most Exported goods are : Integrated Circuits 15.35%, Machinery 12.81%, Vehicles and their parts 11.34%, Mineral Fuels 7.01%, Plastics 5.86%, Iron and Steel 4.23%, Instruments and Apparatus 4.16%, Organic Chemicals 3.85%, Others 35.39%(2019 estm.)


Export-driven: South Korea is the 10th largest exporter in the world. Major exports include semiconductors, petrochemicals, automobiles, and ships. Its ability to innovate and adapt to global market needs has been a significant factor in its export success.

Innovation and Technology: South Korea is a global leader in various high-tech industries. The country boasts the world’s highest broadband penetration, and its firms lead in sectors like mobile technology, semiconductors, and OLED display production.

Chaebols: These conglomerates still play a dominant role in the South Korean economy. While they have been catalysts for growth, they also raise concerns related to corporate governance, competition, and economic disparity.

Education: South Koreans place a high emphasis on education, resulting in a highly skilled and competitive workforce. The country consistently ranks high in global education indices.

Demographics: South Korea has one of the world’s lowest fertility rates. A rapidly aging population puts a strain on the social security system and can lead to potential labor shortages.

Dependency on Exports: While exports have driven growth, over-dependency makes the economy vulnerable to global market fluctuations.

Inter-Korean Relations: Political and military tensions with North Korea have implications for investor confidence and regional stability.

Corporate Governance: While reforms post the 1997 crisis have been implemented, there are still concerns about transparency and accountability within the chaebols.

Challenges also include an aging population, low worker productivity, and the need to implement a structural shift away from overreliance on export-led growth and expansionary fiscal policy.

South Korea’s economic transformation over the past six decades is nothing short of miraculous. A mix of strategic state interventions, entrepreneurial spirit, cultural emphasis on education, and adaptability has propelled the country into the ranks of advanced economies. However, as with all nations, South Korea faces challenges that it must address to ensure continued prosperity. With its track record of overcoming adversity, the South Korean economy’s future remains promising.


Country/RegionExport (M$)Percentage
 China162,12526.8%
 United States72,72012.0%
 Vietnam48,6228.0%
 Hong Kong45,9967.6%
 Japan30,5295.1%
 Russia20,8723.4%
 Taiwan20,7843.2%
 India15,6062.6%
 Philippines12,0372.0%
 Singapore11,7822.0%
 Mexico11,4581.9%
Others173,20128.6%
Total604,860100.0%
Country/RegionImport (M$)Percentage
 China106,48919.9%
 United States58,86811.0%
 Japan54,60410.2%
 Saudi Arabia26,3364.9%
 Germany20,8543.9%
 Australia20,7193.9%
 Vietnam19,6433.7%
 Russia17,5043.4%
 Taiwan16,7383.1%
 Qatar16,2943.0%
 Singapore12,7622.0%
Others177,15333.1%
Total535,202100.0%

Powered by WordPress & Theme by Anders Norén