Tag: Stocks Page 1 of 3

South African Economy: The Lion of Africa

Introduction

South Africa’s economy holds a paradoxical place in the world. It’s one of the most developed and diversified economies on the African continent. Yet, its potential is persistently undermined by deep structural fragilities.

South Africa is rich in mineral resources. It also has a sophisticated financial system and a strong industrial capacity. These elements have long led to South Africa being viewed as a continental economic anchor.

But beneath the surface, chronic challenges hinder growth. These include crippling power shortages, high inequality and a fragile fiscal position. These issues weigh on investor confidence and limit the country’s ability to deliver broad-based prosperity.

Fil:Flag of South Africa.svg – Wikipedia

Illustration 1: Flag of South Africa

To understand South Africa’s economic trajectory, one must explore its dual identity. It is a resource-rich, relatively advanced emerging market. However, it struggles to convert its potential into sustained, inclusive growth. The legacy of apartheid, spatial inequality, and state-owned enterprise mismanagement continues to cast a long shadow. Meanwhile, the government is pursuing reform.

How to safari in South Africa on a budget | South Africa holidays | The  Guardian

Illustration 2: A giraffe spotted during a safari in South African. Image from: How to safari in South Africa on a budget | South Africa holidays | The Guardian

Today, South Africa stands at a crossroads. It could leverage its natural endowments, human capital and reform momentum to enter a new growth phase. Alternatively, it might remain stuck in a low-growth equilibrium, unable to overcome its systemic constraints.

The following article will explore South Africa’s macroeconomic performance, structural strengths, institutional weaknesses and long-term opportunities. We will weave together the latest economic data, reform trends and risk factors. These elements will determine whether South Africa can unlock its promised future.

History and Foundations

Pre-Colonial and Colonial History

Before European colonization, indigenous communities such as the Zulu, Xhosa, Sotho, and Tswana had well-established systems of agriculture.


They practiced pastoralism and trade. Cattle ownership, artisanal crafts, and local trade networks formed the backbone of their economies. These societies demonstrated significant economic organization and regional exchange, long before colonial influence reshaped the subcontinent.

Xhosa warrior, 8th Cape Frontier War, 1850-1853 | Online Collection |  National Army Museum, London

Illustration 3: “Throwing the Assegai” painting showing a Xhosa warrior from 8th Cape Frontier War (1850-1853). Image from Xhosa warrior, 8th Cape Frontier War, 1850-1853 | Online Collection | National Army Museum, London

European settlers arrived and began a significant change in South Africa’s economy. The Dutch arrived first in 1652. Later, the British followed. Colonization introduced formal property systems, trade oriented toward European markets and the appropriation of land from indigenous populations.

The establishment of the Cape Colony and subsequent British expansion laid the foundation for a dual economy. This favored European settlers. It systematically excluded Black South Africans from wealth creation, land ownership, and political participation.

Discovery of Gold and Diamond

The discovery of diamonds in Kimberley in 1867 began South Africa’s transformation.

Gold was then found in the Witwatersrand in 1886. This discovery turned the nation into a mining powerhouse. These discoveries attracted massive domestic and foreign investment and spurred rapid urbanization.

Mining became the primary driver of the economy, stimulating infrastructure development such as railways, ports and telecommunication networks.

However, it also entrenched social and economic inequalities. The system relied heavily on migrant labor. It drew men from rural areas under harsh conditions to work in mines. Wealth accumulated by mining magnates fueled industrial expansion but remained concentrated within a small elite.

Cape Colony map South Africa 19th century history

Illustration 4: Image showing Cape Colony in the 19th century.

Industrialisation and Apartheid

Industrialization during the late 19th and early 20th centuries diversified the economy. Manufacturing sectors such as textiles, food processing, and metalwork emerged alongside mining. The formation of the Union of South Africa in 1910 enabled national coordination of infrastructure and economic policy. Protective tariffs encouraged local manufacturing, but mining exports remained central, exposing the economy to global commodity fluctuations.


The formalization of racial segregation, culminating in apartheid after 1948, profoundly shaped the structural foundations of South Africa’s economy.

Apartheid, Africa's 'Jim Crow' Becomes Law - African American Registry

Illustration 5: A segregation sign in Apartheid South Africa. Image from: Apartheid, Africa’s ‘Jim Crow’ Becomes Law – African American Registry.

The Land Acts of 1913 and 1936 confined Black South Africans to underdeveloped “homelands.” These policies restricted their participation in high-value sectors. Pass laws regulated labor mobility to ensure a steady supply of cheap labor for mines and urban industries. The state supported industrial growth primarily for white-owned businesses.

Black South Africans were largely excluded from ownership. They lacked access to credit and skilled employment. Despite this, industrialization advanced in several areas. Notably, it progressed in energy, transport, and urban manufacturing hubs. This development created a modern industrial base, even within a deeply unequal society.

The late apartheid period brought additional pressures, including international sanctions, divestment, and internal resistance. The economy relied increasingly on mechanized mining, state-owned enterprises and financial markets to maintain growth.

At the same time, rising labor unrest and political instability highlighted structural weaknesses. These inequalities would become central challenges for the post-apartheid era.

The transition to democracy in 1994 marked a turning point. The ANC-led government inherited an economy with advanced infrastructure. It had a strong industrial base and a sophisticated financial sector. However, there was also severe inequality, underdeveloped rural areas, and limited human capital among the majority population.

Early reforms included the Reconstruction and Development Programme (RDP). The Growth, Employment and Redistribution (GEAR) strategy also aimed to balance social redress. They pursued macroeconomic stability. They opened South Africa to global trade and foreign investment. These reforms also addressed long-standing inequities.

Modern South Africa

Today, South Africa’s economic structure reflects this layered history. It features a modern, globally integrated industrial and financial sector.

South Africa | National Geographic Kids

Illustration 6: Boulders Beach in Cape Town, South Africa. Image from: South Africa | National Geographic Kids


The economy of South Africa is currently the largest economy in Africa as of October 2025. It is a mixed economy, emerging market and upper-middle-income economy, and one of only eight such countries in Africa.

Cape Town is SA’s second-largest city by population. It serves as Africa’s tech hub and has a large startup community. The city is popular among digital nomads. The city is home to hundreds of tech firms, and is referred to as the “Startup Capital of Africa”.

Illustration 7: Cape Town, South Africa. Image from: Vacations in South Africa: these are the most beautiful places

However, there are persistent inequalities. A dual labor market exists, along with uneven development between urban and rural areas.

South Africa levies a top personal income tax rate of 45%. It also imposes a corporate tax rate of 27%, alongside value-added and capital gains taxes. This results in an overall tax burden of about 23.4% of domestic income.

Key Industries and Sectors

Mining and Natural Resources

Mining has historically been the backbone of South Africa’s economy, shaping its industrialization, urbanization, and global trade presence. Diamonds were discovered in Kimberley in the late 19th century. This event, followed by the gold rush in the Witwatersrand, established South Africa’s mineral wealth as a global mining powerhouse.

Mining has created employment opportunities, generated export revenue, and funded infrastructure development. Platinum, gold, diamonds, coal, manganese, and chrome remain critical exports. South Africa accounts for a significant share of global supply, especially in platinum and manganese.

South Africa: Thousands rush for "diamonds" in Kwazulu-Natal province |  Africanews

Illustration 8: Diamond discovered in Kwazulu-Natal province in South Africa. Image from: South Africa: Thousands rush for “diamonds” in Kwazulu-Natal province | Africanews


In 2019, South Africa ranked among the world’s leading producers of several key minerals. It was the largest global producer of platinum, chromium, and manganese. The country was the second-largest producer of titanium. It was also the third-largest producer of vanadium.

World's deepest gold mine shut down due to COVID-19 | Daily Sabah

Illustration 9: A mine in South Africa. Image from: World’s deepest gold mine shut down due to COVID-19 | Daily Sabah

The country also held prominent positions in other sectors. It was the 6th-largest producer of iron ore. It ranked as the 11th-largest producer of both gold and cobalt. It was the 15th-largest producer of phosphate. In 2018, South Africa was the world’s 12th-largest uranium producer.

However, the sector faces mounting structural challenges. Ore quality is declining, making extraction more expensive and technologically demanding. Deep-level mining, particularly for gold, involves complex engineering and escalating safety concerns.

Analysts warn that without substantial reinvestment in technology and workforce training, key operations could become economically unviable within decades. Rising operational costs, coupled with fluctuating global commodity prices, place additional pressure on profitability.

Illegal mining, locally referred to as “zama zamas,” presents a parallel challenge. These informal operations not only undermine formal mining companies by diverting resources. They also reduce legal production volumes.

Additionally, they exacerbate safety risks, cause environmental degradation, and complicate regulatory enforcement. Mining companies face significant difficulties navigating bureaucratic delays in permits and licenses. Environmental compliance adds to these issues. These challenges further discourage both domestic and foreign investment.

Environmental and social pressures are also growing. Mining is energy-intensive, water-intensive, and environmentally disruptive, and South Africa faces heightened scrutiny regarding sustainable practices and social responsibility.

Getty Images A worker holds a handful of gold bullion granules during manufacture at a plant in Germiston, South Africa, on 16 August 2017

Illustration 10: Gold from a Zama Zamas

Communities around mines demand benefits and fair labor practices, while environmental groups emphasize rehabilitation and water management. Transitioning to sustainable mining practices is essential. Adopting modern technology is necessary. Addressing labor and regulatory challenges is crucial if the sector is to remain a pillar of the economy


Mining’s share of South Africa’s GDP has declined from 21% in 1970 to just 6% in 2011. However, the sector continues to dominate the country’s export profile. It accounts for nearly 60% of total exports. Mining also contributes approximately 9% of the nation’s value added.

The industry is anchored by some of the country’s largest and most influential companies. These include Anglo American, one of the world’s leading diversified mining firms. Sibanye Stillwater is a major producer of gold and platinum group metals. Impala Platinum is a top global platinum miner. These companies not only drive significant export revenue but also shape employment, technological innovation, and investment patterns within the sector.

South African Agriculture

Agriculture plays a modest but important role in South Africa’s economy. It formally employs around 5% of the workforce. Additional work is provided through casual and seasonal labor.

Citrus farming in South Africa – get in on the excitement! -

Illustration 11: Citrus farming in South Africa. Image from:Citrus farming in South Africa – get in on the excitement! –

The sector contributes approximately 2.8% to national GDP. This is a relatively low share compared to other African countries. However, its social and economic significance extends beyond these figures.

It supports rural livelihoods, food security, and exports. South Africa is a leading exporter of fruit, wine, nuts, and sugar. Its agricultural products, like wine and citrus, reach premium markets globally.

The Best Wine Regions in South Africa | Jacada Travel

Illustration 12: Vineyard in South Africa near Cape Town. Image from: The Best Wine Regions in South Africa | Jacada Travel.

The sector provides employment in rural areas and is essential for community stability, especially where alternative economic opportunities are scarce.

South Africa is a major global producer of a range of agricultural products. In 2018, the country produced 19.3 million tonnes of sugarcane, ranking 14th worldwide; 12.5 million tonnes of maize, the 12th largest globally; 1.9 million tonnes of grapes and 1.7 million tonnes of oranges, both 11th largest; and 397,000 tonnes of pears, the 7th largest producer in the world.

Beyond these staples, South Africa ranks among the top global producers of several other crops. These include chicory roots and grapefruit (both 4th), cereals (5th), and green maize and maize (7th). Additionally, castor oil seed and pears rank 9th. Sisal and other fiber crops are ranked 10th. Despite its strengths, the sector faces significant challenges, including increasing foreign competition and persistent crime affecting farms.

Farm attacks, in particular, have sparked debate over government intervention. Some critics argue that authorities either over-prioritize this issue or under-prioritize it relative to other forms of violent crime.


Furthermore, agriculture is increasingly vulnerable to climate change, including droughts, shifting rainfall patterns, and water scarcity.

A fresh approach to land reform

Illustration 13: Land reform continuous to be a very controversial topic in South Africa. Image from: A fresh approach to land reform

Land reform policies, though critical for historical redress, create uncertainty over tenure and investment incentives, slowing modernization and mechanization. Rural infrastructurelm including irrigation systems, transport networks and storage facilities, requires significant development to improve productivity and competitiveness.

Investments in climate-resilient practices, sustainable irrigation, and agro-processing can enhance the sector’s economic impact while addressing social imperatives.

Manufacturing and Industry

South Africa’s industrial sector is diversified. It encompasses downstream mineral processing, automotive manufacturing, and chemicals. It also includes food and beverage processing, machinery, and construction materials.

The manufacturing sector plays a modest role in South Africa’s economy, accounting for approximately 13.3% of employment and contributing around 15% of GDP. Certain segments of the industry are experiencing growth, including advanced sectors such as aerospace and space technology.

While labor costs remain relatively low compared to developed economies, they are higher than in many other emerging markets. At the same time, expenses for transport, communications, and general living add to the overall cost of doing business. These costs present challenges for competitiveness. They also hinder expansion within the sector.

The automotive sector, in particular, is a significant exporter. It employs thousands in assembly plants for both domestic consumption and global markets. The country is also a hub for automotive manufacturing.

It hosts production plants for major global companies. These include BMW, Ford, Volkswagen, Daimler-Chrysler, General Motors, Nissan, and Toyota. Companies producing in South Africa enjoy benefits from relatively low production costs.
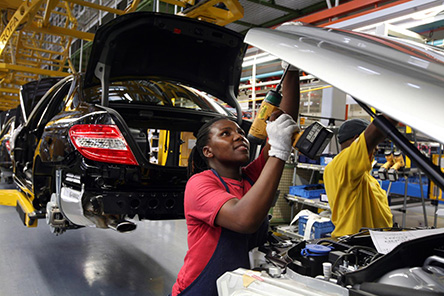
Sales of new cars in South Africa on decline - Auto Auto Parts Africa:  Connecting African Importers & Buyers

Illustration 14: Car Manufacturing hub in South Africa. Image from: Sales of new cars in South Africa on decline – Auto Auto Parts Africa: Connecting African Importers & Buyers


They gain preferential access to new markets through trade agreements with the European Union and the Southern African Development Community. Chemical production, steel and ferroalloy processing, and other industrial activities complement mining, creating an interconnected industrial ecosystem.

Despite these strengths, the sector faces persistent constraints. High electricity costs, largely driven by reliance on Eskom’s aging coal-powered generation fleet and inconsistent supply, create uncertainty for manufacturers.

Power outages and load shedding disrupt production schedules, reduce output, and erode investor confidence. Logistical bottlenecks, including underdeveloped rail systems, port congestion and inadequate road maintenance, further hinder competitiveness, particularly for export-oriented firms.

South Africa's roads are collapsing – BusinessTech

Illustration 15: South African roads present a challenge for export-driven businesses.

The regulatory environment is intended to protect labor and consumers. However, businesses often cite it as cumbersome and inconsistent. This increases compliance costs and reduces agility. Many manufacturing firms operate at a scale below global competitors.

This limits their ability to achieve economies of scale. It also hinders their capacity to innovate or compete on price. Reforming state-owned enterprises (SOEs) is crucial. Investing in transport infrastructure is also essential. Additionally, reliable energy provision is needed. These actions are widely recognized as prerequisites for revitalizing industrial capacity.

Emerging industrial opportunities exist in high-tech manufacturing, advanced materials and agro-processing. South Africa can leverage its mining expertise in these industries. It can also use its engineering capabilities and research infrastructure. However, realizing this potential requires consistent policy support, streamlined regulation and investment in skills development and technology adoption.

Tourism

Tourism significantly impacts South Africa’s economy. It contributes to both GDP and employment. It also showcases the country’s rich natural, cultural, and historical assets.

Table Mountain Tour, South Africa | Audley Travel US

Illustration 16: Table Mountain in Cape Town, South Africa. Image from Table Mountain Tour, South Africa | Audley Travel US


South Africa offers a diversity of experiences. The iconic Table Mountain and Cape Town’s vibrant urban culture. The wildlife-rich Kruger National Park. Each destination attracts millions of visitors each year.

3 Day Kruger National Park Safari - Kruger Lodge Tour

Illustration 17: Safari in Kruger National Park, SA. Image from: 3 Day Kruger National Park Safari – Kruger Lodge Tour

The scenic Drakensberg mountains further enhance its appeal. The tourism industry supports a wide range of jobs. This includes hospitality, travel services, transportation, and cultural attractions. These are particularly important in regions where other employment opportunities are limited.

South Africa is renowned for wine tourism. It is also famous for its culinary attractions. The Cape Winelands region is a major draw for international visitors. However, the sector faces several challenges. These include seasonal fluctuations, infrastructure bottlenecks, and concerns over safety and security. These challenges can influence traveler perceptions.

Exchange rate volatility affects inbound tourism. Global economic trends also play a role. They make the industry highly sensitive to both domestic and international developments.

Despite these challenges, tourism remains a strategic sector for foreign exchange earnings. It contributes to regional development and promotes South Africa’s global brand.

Finance

South Africa’s financial sector is highly sophisticated on the African continent. It boasts a well-developed banking system, capital markets, and insurance sector. M

ajor banks such as Standard Bank, FirstRand, and Absa provide a broad range of services. International institutions operating locally also offer retail, corporate, and investment services.

The Johannesburg Stock Exchange (JSE) is the largest in Africa. It serves as a key hub for capital raising, equity trading, and investment. It connects South African companies with domestic and international investors.

Moving to South Africa - Living in Johannesburg

Illustration 18: The city of Johannesburg, South Africa which is major African finance hub. Image from Moving to South Africa – Living in Johannesburg.

The insurance sector includes firms such as Old Mutual and Sanlam. It plays an important role in risk management. It also contributes to wealth preservation.


The financial sector is highly advanced. However, it faces challenges related to regulatory compliance, cyber-security risks, and ensuring financial inclusion for underserved populations.

Efforts to expand access to banking, mobile finance, and fintech solutions are ongoing. These efforts aim to integrate a broader segment of the population into the formal financial system. The robustness of the financial sector positions South Africa as a regional financial hub.

Informal Economy

The informal economy is a critical part of South Africa’s socioeconomic landscape. It provides employment and income for millions. These individuals are unable to access formal labor markets.

Halvdagstur i Cape Town Township in Cape Town

Illustration 19: A township in Cape Town, South Africa witht the table mountains in the background. Image from: Error 404 : Not found | My Guide Cape Town

Activities in this sector include street vending, small-scale trade, domestic work, informal transport services, and artisanal production. The informal economy is particularly vital in urban townships and rural areas. It helps sustain livelihoods and supports local communities.

Despite its importance, the sector faces significant challenges. Workers often lack legal protections, access to credit, and social security. They also lack regulatory recognition. This makes them vulnerable to economic shocks. C

rime, market restrictions, and limited infrastructure further constrain informal businesses. The informal economy contributes significantly to household income and local economic activity. It acts as a buffer against unemployment and poverty. This highlights its social and economic importance alongside formal sectors.

Green Energy and Transition

South Africa’s transition to a green economy represents both a challenge and a significant opportunity. The country is rich in critical minerals essential for renewable energy technologies. These include lithium, cobalt, nickel, and platinum group metals.

This positions it to benefit from the global shift toward electric vehicles and battery storage. Strategic investment in these minerals, combined with sustainable mining practices, could create high-value export opportunities and stimulate industrial innovation.

Scaling renewable energy production is central to this transition. Solar, wind, and hydroelectric projects can reduce reliance on coal, mitigate environmental impact, and stabilize energy supply.

Expanding the transmission grid, encouraging private investment, and reforming energy governance are vital to unlocking the green economy’s potential.


According to the OECD, integrating renewable energy could support emissions reduction targets. Electrification of transport and clean-energy industrialization can also create new jobs. These strategies diversify the economy and enhance global competitiveness.

Incredible growth' in rooftop solar in South Africa – The Mail & Guardian

Illustration 20: Solar panels being installed in South Africa.

However, success depends on coordinated policy, regulatory clarity, and investment in human capital. South Africa must address governance bottlenecks.

It also needs to tackle infrastructure gaps and financing challenges. Otherwise, it risks underutilizing its renewable potential. Additionally, South Africa may miss opportunities in the rapidly growing global green economy.

Fiscal Health and Macroeconomics

South Africa’s macroeconomic trajectory has been sluggish in recent years. According to the IMF, growth was only 0.7% in 2023, constrained by persistent power outages and logistical bottlenecks in rail and port operations.

The OECD likewise estimates that economic activity slowed to around 0.6% in 2024, reflecting continued uncertainty and infrastructure bottlenecks.

This weak growth has major implications for fiscal health. Public debt has ballooned: from 31.5% of GDP in 2010 to a projected 77% by 2025, according to OECD data.

The cost of servicing this debt is rising sharply. The OECD estimates that by 2025, interest payments will absorb roughly 5.2% of GDP, a major drain on the state’s ability to fund other priorities. These fiscal pressures limit the government’s capacity to invest in infrastructure. They also hinder investment in education and social programs. These elements are the very levers needed to unlock long-term growth.

At the same time, the IMF notes that inflation has moderated: from around 5.9% in 2023 to an estimated 4.5% in 2024, and the South African Reserve Bank (SARB) responded by cutting interest rates. This easing of monetary policy provides some breathing room, but it is balanced against the risk of weakening fiscal discipline.

South Africa Culture and Traditions: What to know | Goway Travel

Illustration 21: Traditional South African Instruments. Image from: South Africa Culture and Traditions: What to know | Goway Travel

Comparison with other emerging markets


South Africa stands out among emerging markets in several areas. Its financial markets are among the most developed on the continent. They offer relatively easy access to capital. The country has competitive business tax rates compared with peers.

Transport infrastructure includes ports, rail networks, and roads. It is generally considered superior to that of many emerging economies, such as India, Brazil, Mexico, and China. However, it still lags behind advanced emerging markets like South Korea and Chile.

Conservation and the Big Five on a South Africa Safari

Illustration 22: A black rhino in the marataba private reserve. Image from: Conservation and the Big Five on a South Africa Safari.

Foreign direct investment has historically been strong, at over 3% of GDP in the late 2000s, reflecting international confidence in certain sectors of the economy.

Despite these strengths, South Africa faces structural challenges that hinder its competitiveness relative to other emerging economies. Labour costs are higher than in most peer countries, and the availability of skilled workers is constrained by an underperforming education system.

The country’s domestic market is relatively small, limiting scale advantages that nations like China and India enjoy. Moreover, energy supply has been unreliable, with frequent power shortages affecting industrial output and investor confidence.

SAHRC finds Stellenbosch University violated human rights of  Afrikaans-speaking students with English-only policy - SA People

Illustration 23: University of Stellenbosch, one of the highest ranked South African Universities. Image from: SAHRC finds Stellenbosch University violated human rights of Afrikaans-speaking students with English-only policy – SA People.

Innovation and technology adoption are also slower compared with leading emerging markets. This makes it difficult for South Africa to maintain a high-growth trajectory in advanced manufacturing or tech-driven sectors.

On a more positive note, the country has niche strengths, like in aerospace and space technology. South Africa joined the BRICS group in 2011. This inclusion cemented its position among major emerging economies. It provided increased global visibility and created opportunities for investment.

However, to sustain competitiveness, the country needs to improve education. It must invest in infrastructure and ensure a stable energy supply. Policies should be implemented to enhance innovation and productivity. These measures will ensure the country does not fall behind rapidly developing peers.


Inequality and Social Dynamics

One of the most destabilizing aspects of South Africa’s economic challenge is unemployment, particularly chronic and youth unemployment. The OECD reports that the formal employment rate remains low. Only a relatively small share of the working-age population participates in productive, high-quality jobs.

According to IMF data, the unemployment rate was estimated at 32.8% in 2024. Many young people, especially in marginalized communities, find themselves locked out of labor‑market opportunities. This weak job creation is not just a social issue, it undermines human capital development and limits consumer demand.

Inequality in South Africa is profound and persistent. The World Bank notes a very high Gini coefficient for income. Additionally, a significant portion of the population lives in poverty.

South Africa's unemployment rate rises to 32.9% | Lagos to Jozi Blog

Illustration 24: Protests against the high unemployment rate in South Africa . Image from South Africa’s unemployment rate rises to 32.9% | Lagos to Jozi Blog

Social grants help to cushion the poorest, but they are not a substitute for meaningful inclusion in economic activity. According to OECD analysis, many of the unemployed rely on social assistance.

The spatial legacy of apartheid remains evident. Many low-income households live far from economic hubs. This distance exacerbates inequalities. It makes labor mobility and access to opportunity difficult.

Why Africa is one of the most unequal continents in the world

Illustration 25: Two different neighborhoods in South Africa illustrating the inequality.

State-owned enterprises (SOEs) also contribute to social strain. Governance failures, corruption, and inefficiency within SOEs drain public resources.

Black Economic Empowerment (BEE) is a policy framework in South Africa designed to redress the economic inequalities created by apartheid. However, the program has faced criticism for benefiting a relatively small elite. It has not broadly

In 2002, roughly 62% of black Africans lived below the poverty line. About 29% of coloured and 11% of Indians were also below the poverty line. Additionally, 4% of whites lived below the poverty line. Average incomes have risen unevenly. Black households increased from R6,018 in 1993 to R9,718 in 2008. In contrast, white households rose from R29,372 to R110,195.

Median income grew much less than the mean, showing that wealth gains are concentrated among the richest. The black middle class and wealthy population have expanded despite these challenges. Nearly 40% of the richest 10% are now black.


Land Reform and Land Distribution

Land reform has been a central and highly sensitive issue in South Africa since the end of apartheid. The legacy of racially skewed land ownership continues to shape the country’s social and economic landscape.

Under colonial and apartheid rule, a white minority owned most productive land. In contrast, the black majority was confined to underdeveloped homelands or smallholdings.

The 20 Best Luxury Villas near Cape Town in 2024

Illustration 26: Villa near Cape Town, South Africa. Image from: The 20 Best Luxury Villas near Cape Town in 2024

The government’s land reform program seeks to address these historical injustices. It does so through three main pillars: land restitution, land redistribution, and tenure reform.

Land restitution provides compensation or returns land to those dispossessed under discriminatory laws. Land redistribution aims to transfer land to historically disadvantaged individuals. Tenure reform secures rights for people living on communal or leased land.

Despite these efforts, progress has been slow and uneven. By 2020, only about 10% of agricultural land had been redistributed. Many beneficiaries struggle with limited access to finance, inadequate infrastructure, and lack of farming experience, which in some cases has led to reduced productivity.

The debate over expropriation without compensation (EWC) has intensified in recent years.

Proponents argue it is essential to accelerate equity. They believe it will empower rural communities. Critics warn that poorly implemented EWC could threaten agricultural output. It might also deter investment and harm food security.

Trade and Global Position

South Africa’s economy is closely tied to global markets, with exports accounting for roughly 30% of GDP.

Minerals dominate its export profile, including platinum, gold, diamonds and iron ore, while automotive manufacturing, agriculture and chemicals also contribute significantly.

Imports are concentrated in machinery, electronics, petroleum, and chemicals. This creates structural dependencies. These dependencies make the economy sensitive to global price fluctuations.

China, the European Union, the United States, and neighboring African countries are South Africa’s main trading partners. China receives a large share of metals and minerals. Germany imports vehicles and machinery.

Regional trade through the SADC supports food and manufactured goods exports. Trade agreements with the EU, AfCFTA, and other partners provide market access and encourage foreign investment.

Ukraine-Russia War: Fallout From South Africa's Alleged Arms Shipments to  Russia

Illustration 27: Russian Minister of Foreign Affairs of Sergei Lavrov meets with South African Minister of International Relations and Cooperation Naledi Pandor during a press conference in Pretoria, South Africa, on Jan. 23. Image from: Ukraine-Russia War: Fallout From South Africa’s Alleged Arms Shipments to Russia


The South African rand (ZAR) plays a critical role in trade but is highly volatile. The South African Reserve Bank manages inflation and currency fluctuations through monetary policy, but global capital flows often influence outcomes.

Rand | Exchange Rate, Inflation & Devaluation | Britannica Money

Illustration 28: Two Hundred Rand. Image from Rand | Exchange Rate, Inflation & Devaluation | Britannica Money.

Exports remain heavily commodity-based. Metals and minerals contribute around 60% of export revenue. Agriculture accounts for about 10%, and manufactured goods roughly 20%.

Imports are dominated by machinery, electronics, and petroleum. Export-oriented manufacturing hubs and industrial incentives aim to diversify trade. However, reliance on raw materials exposes South Africa to commodity price swings. It also makes South Africa vulnerable to global economic cycles.

Credit Rating

South Africa’s sovereign credit rating is a key indicator of its fiscal stability and investment risk. Moody’s currently assigns the country a Baa3 rating with a negative outlook.

This highlights the pressures from high public debt. The country also faces persistent budget deficits and ongoing support requirements for state-owned enterprises such as Eskom.

Fitch and Standard & Poor’s both rate South Africa at BB+ with negative outlooks. They emphasize structural challenges. These include slow economic growth, high unemployment, inequality, and policy uncertainty.

Historically, South Africa maintained investment-grade ratings in the early 2000s, supported by strong institutions and fiscal discipline. However, repeated downgrades over the past decade show the impact of rising debt, energy constraints, and slow reforms. These issues have increased borrowing costs and affected investor confidence.

The negative outlook indicates that further fiscal deterioration could lead to additional downgrades. Policy missteps might also trigger such downgrades.

On the other hand, successful reforms could stabilize the country’s ratings. Improved economic performance could even enhance the ratings.

Wildlife in South Africa - Types of South African Animals - A-Z Animals

Illustration 29: a springbok, image from Wildlife in South Africa – Types of South African Animals – A-Z Animals

Risk and Vulnerabilities

The risks facing South Africa’s economic future are both immediate and structural. The energy crisis remains the single largest drag. Load shedding eased in 2024, but the system remains fragile. Outages returned in early 2025.


Many firms, especially SMEs still lack the capital to build their own backup power, making them especially vulnerable. SOEs remain a fiscal risk.

Eskom, Esko, Esk ... load shedding – Salaamedia

Illustration 30: Eskom coal plant near Johannesburg. Image from: Eskom, Esko, Esk … load shedding – Salaamedia

Entities like Eskom and Transnet need deep governance reform, capital injection, and operational restructuring. If mismanagement continues, these companies could remain a drag on government finances. They might fail to deliver the infrastructure needed for growth

South Africa faces a persistent and severe employment problem, with unemployment rates among the highest in the world. As of 2025, the official unemployment rate hovers around 33%, while youth unemployment exceeds 60%.

Informal employment remains widespread, providing livelihoods but often lacking stability, social protections or career advancement. High unemployment exacerbates inequality and fuels social tensions. It also constrains domestic demand. Therefore, job creation is a central challenge for sustainable economic growth.

South Africa experiences significant human capital flight. Many skilled professionals leave for countries offering better pay, safety, and career opportunities.

This “brain drain” is caused by high crime rates. It is also due to political instability, slow economic growth, and limited prospects in the domestic labor market.

The loss of talent hampers productivity. It reduces innovation and weakens critical sectors. This situation makes it a persistent challenge for the country’s long-term economic development.

Immigration and "Brain Drain" - Econlib

Illustration 31: South Africa is experiencing significant brain drain. Image from: Immigration and “Brain Drain” – Econlib

Corruption and weak institutional capacity also pose major risks. Without credible institutions, investor confidence will remain fragile, and reform momentum could stall.

The country has a very high ratio of social benefit recipients to taxpayers. Since 1994, social spending has been heavily directed toward black households. Today, black South Africans receive roughly 80% of government transfers while contributing around half of total taxes.


The transition to a greener global economy presents both opportunities and risks. If South Africa fails to modernize its mining sector, it could be left behind. This is especially true as demand for green metals surges.

Strengths and Long-Term Opportunities

South Africa’s economy stands out for its strong and diverse foundations. It is one of the most diversified economies on the African continent. The country has well-developed sectors in mining, manufacturing, finance, agriculture, tourism, and services.

The country has an abundance of natural resources. These include gold, platinum, diamonds, coal, and other rare minerals. This wealth continues to be a major economic driver.

It is also a key attraction for global investors. This rich resource base has also helped build a sophisticated mining industry with world-class expertise.

Another major strength is South Africa’s advanced financial sector. Johannesburg hosts one of the largest and most developed stock exchanges in the world. Stable banking institutions and sound regulatory frameworks support it.

The country also benefits from strong physical infrastructure. It includes an extensive network of highways, rail systems, and modern ports. These facilitate efficient trade and logistics. Its energy and telecommunications infrastructure are among the best in the region.

South Africa’s workforce is comparatively skilled. This is particularly true in technical, engineering, and financial fields. This expertise supports the country’s industrial and service sectors.

The nation serves as a strategic gateway. It provides a strong base for companies seeking access to the rest of Africa and their regional operations. The growing technology, renewable energy, and automotive sectors further enhance South Africa’s long-term economic potential.

The future of South Africa: seven things that need to happen | ISS Africa

Illustration 32: The economy of South Africa can have a bright future given its resource rich environment and skilled workforce. Image from The future of South Africa: seven things that need to happen | ISS Africa.

Target: Stock Analysis

Introduction

Target Corporation has grown from a single discount store into one of the most iconic retail brands in the United States.

Target Announces Plans to Right-Size Inventory | Shop Eat Surf Outdoor

Illustration 1: The iconic Target Bullseye Logo

Known for its signature red logo and “Expect More. Pay Less.” philosophy, Target has become a favorite destination for millions of shoppers who value style, convenience, and affordability. From groceries to fashion, home goods to electronics, Target has it all.

From its Minneapolis headquarters, Target manages hundreds of stores across the United States, a sophisticated e-commerce platform, and a growing network of fulfillment and distribution centers.

Its guiding philosophy of blending affordability with style and quality has helped it carve out a unique position in retail.

Unlike traditional retailers that grew cautiously, Target expanded strategically. It focused on curated product offerings. It also emphasized smart store locations and innovative marketing.

By integrating online and offline shopping experiences, Target continues to capture the hearts and wallets of millions.

History

The Target story began in 1962, when George Dayton’s Dayton Company opened the first Target store in Roseville, Minnesota.

From the start, Target differentiated itself from competitors by offering a higher-quality shopping experience at affordable prices.

What Target Looked Like When the Retail Giant First Opened - Business  Insider

Illustration 2: The first ever Target store in 1962. Image gathered from: What Target Looked Like When the Retail Giant First Opened – Business Insider


During the 1970s and 1980s, Target expanded steadily across the Midwest. It also expanded in the Southern United States. The focus was on locations that allowed it to serve growing suburban communities.

vintage target

Illustration 3: Vintage photage from a Target store in the 80s. Gathered from Vintage Photos of What Target Used to Look Like – Business Insider

Unlike discount chains that competed purely on price, Target invested in store design. It also focused on product quality and customer experience. As a result, it earned a loyal following among middle-class Americans.

In the 1990s, Target introduced its SuperTarget stores, combining general merchandise with full grocery sections. This move positioned Target as a one-stop-shop for families, directly challenging Walmart’s dominance in grocery and household essentials.

Target’s expansion has always balanced growth with brand identity. While Walmart pushed for sheer scale, Target cultivated a reputation for style, design, and a curated shopping experience.

In recent years, Target has also embraced digital transformation. Its e-commerce operations, delivery services, and membership programs help it compete with online giants like Amazon.

Target debuts a super-sized new store design

Illustration 4: A Target Superstore that competes directly with Walmart superstores. Image from Target debuts a super-sized new store design.

Today, Target operates over 1,900 stores nationwide. It employs hundreds of thousands of team members. The company continues to grow its online marketplace and attracts millions of customers every week.

Operations


Nationwide Presence

Target generates revenue through a diverse mix of product categories and services. It blends its physical retail operations with a rapidly expanding digital presence.

Target Unwraps Immersive Store and Digital Experiences for Holiday Shoppers  - Retail TouchPoints

Illustration 5: Chritstmas products at target, image from Target Unwraps Immersive Store and Digital Experiences for Holiday Shoppers – Retail TouchPoints.

The company’s core revenue comes from general merchandise, including apparel, home goods, electronics, and beauty products. Its private-label brands, such as Goodfellow & Co. and Up & Up, allow Target to offer stylish, high-quality products at competitive prices. This strategy creates strong customer loyalty and results in higher margins.

Groceries and everyday essentials are another key revenue driver. SuperTarget and traditional Target locations provide fresh produce, packaged foods, and household staples. This segment not only drives foot traffic but also encourages larger shopping baskets.

E-commerce has emerged as a critical growth engine for Target. Its online platform integrates traditional retail with innovative delivery options, including curbside pickup, same-day delivery through Shipt, and a seamless digital marketplace

Membership and loyalty programs, especially Target Circle, enhance revenue. They offer personalized deals, rewards, and promotions. These incentives drive repeat purchases. These initiatives have allowed Target to capture convenience-oriented shoppers. They also capture value-conscious shoppers. This positions Target as a hybrid retailer that thrives across channels.

Target’s Supply Chain

Target’s supply chain is one of its most critical competitive advantages. The company uses strategically located distribution centers and centralized procurement. It has an advanced logistics network. This setup moves goods efficiently from suppliers to stores and directly to customers.

Its sophisticated inventory management systems reduce waste. They maintain stock accuracy and keep pricing competitive. Its private trucking fleet ensures timely delivery across the country. B

Capping off National Truck Driver Appreciation Week, thank you to all of  our transportation partners who help us serve our guests. We appreciate you!

Illustration 6: A target Truck.

By combining technology, scale, and operational discipline, Target’s supply chain supports both its physical stores and e-commerce operations. This combination enables the company to offer convenience and reliability that few competitors can match.


Key Competitors

Target operates in a highly competitive retail landscape. Walmart is its most formidable rival. It leverages unmatched scale and a vast grocery footprint. Walmart’s low-price leadership captures a broad segment of everyday shoppers.

Amazon Go Grocery: This Is The Future Of Shopping, Whether We Like It Or Not

Illustration 7: Amazon Go Grocery is becoming a big competitor. Image from Amazon Go Grocery: This Is The Future Of Shopping, Whether We Like It Or Not

Walmart’s aggressive pricing and expansive store network create constant pressure on Target, particularly in mass merchandise and grocery categories. Please see our article for more information about Walmart: Walmart: Stock Analysis (Nov. 2025) – Insightpost %.

Online retail adds another layer of competition. Amazon has reshaped consumer expectations around convenience, delivery speed, and product variety, directly challenging both Target’s digital and physical offerings.

Amazon’s dominance in e-commerce is significant. Its expanding footprint in grocery delivery poses a continuous threat. This forces Target to innovate across its online channels and fulfillment capabilities.

Membership-based retailers such as Costco present another form of competition. By offering bulk products at discounted prices, Costco attracts cost-conscious, loyalty-driven shoppers, directly challenging Target.

Similarly, Dollar General and Dollar Tree continue to expand aggressively in smaller, value-focused markets. They target regions and segments where Target’s larger-format stores may not fit.

Traditional grocers like Kroger, Albertsons, and Publix also compete with Target’s SuperTarget locations in fresh foods and groceries. Meanwhile, global retailers such as Aldi, Lidl, and Carrefour apply additional pressure. They use regional expertise, low-cost strategies and increasingly sophisticated digital tools.

Rayon fromage moyen dans un supermarché italien. C'est seulement un tiers  du tout cependant (le Parmigiano Reggiano a sa propre section, bien sûr) :  r/Cheese

Illustration 8: Carrefour cheese section

Competitive Advantages

Target’s strongest advantage lies in its brand identity. Unlike Walmart, which prioritizes scale and the lowest possible prices, Target has built a reputation around style. It focuses on an elevated shopping experience.


Technology and operational efficiency are central to Target’s advantage. The company has made significant investments in e-commerce, fulfillment, inventory management, and automation.

Its growing network of micro-fulfillment centers and advanced inventory tracking allow Target to process orders quickly. Integrated digital systems ensure accuracy. Customers receive their products with speed and convenience.

Target’s nationwide distribution network and strategically placed store footprint further enhance its efficiency. Products move rapidly from suppliers to stores. They are delivered directly to customers. This is supported by a logistics system that rivals the best in retail.

See next page for Stock analysis,


Stock Analysis

In this section we will analyze Target’s stock to see if it is a good stock to buy or not. Our philosophy is value investing meaning that we try to find good quality companies that are undervalued. However, we will give a holistic overview. This allows all kinds of investors with different philosophies to judge the stock for themselves.

Revenue and Profits

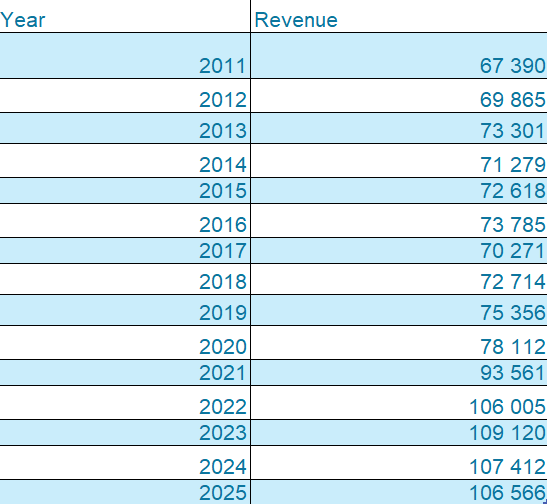
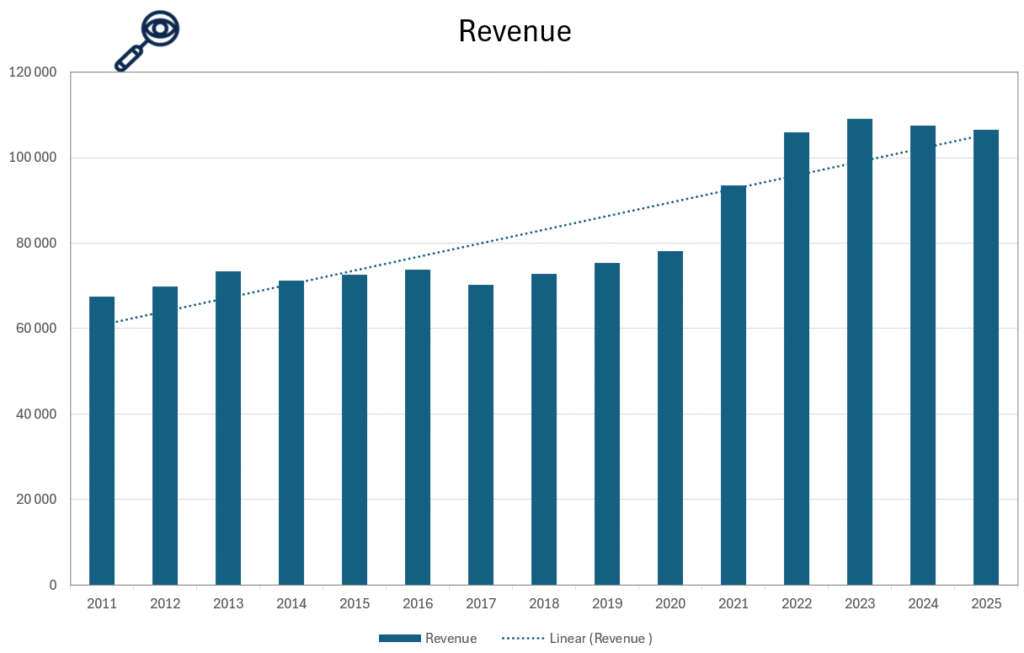
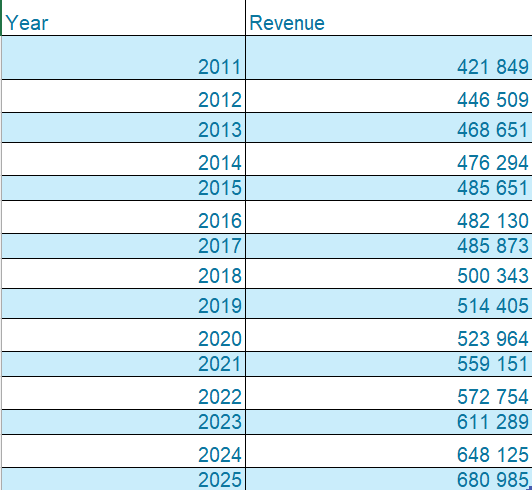
Illustration 9 and 10: Revenue of Target from 2011 to 2025

As shown in Illustrations 9 and 10, Target’s revenue has experienced significant fluctuations over the years. From 2011 to 2020, revenue mainly stayed around the same level. This period reflects stagnation and can be considered a negative signal for consistent growth. The overall trend from 2011 to 2025 has been positive. However, recent data from 2022 to 2025 show that Target continues to experience volatility. Revenue is rising and falling rather than steadily increasing.

Target’s revenue performance between 2015 and 2017 was impacted by various factors, including heightened competition in the U.S. market and operational adjustments in certain underperforming segments, which temporarily suppressed earnings growth.

Overall, while Target has achieved long-term growth from 2011 to 2025, the recurring fluctuations indicate areas of inconsistency. This suggests that investors should be aware of the company’s cyclical performance when considering its stability and long-term prospects. The fluctuation is a red flag that the company has a hard time achieving steady growth.

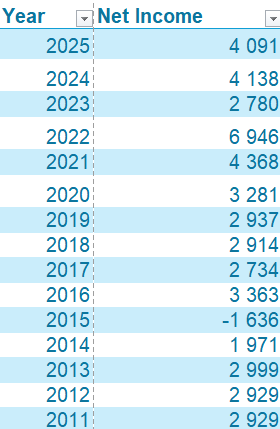
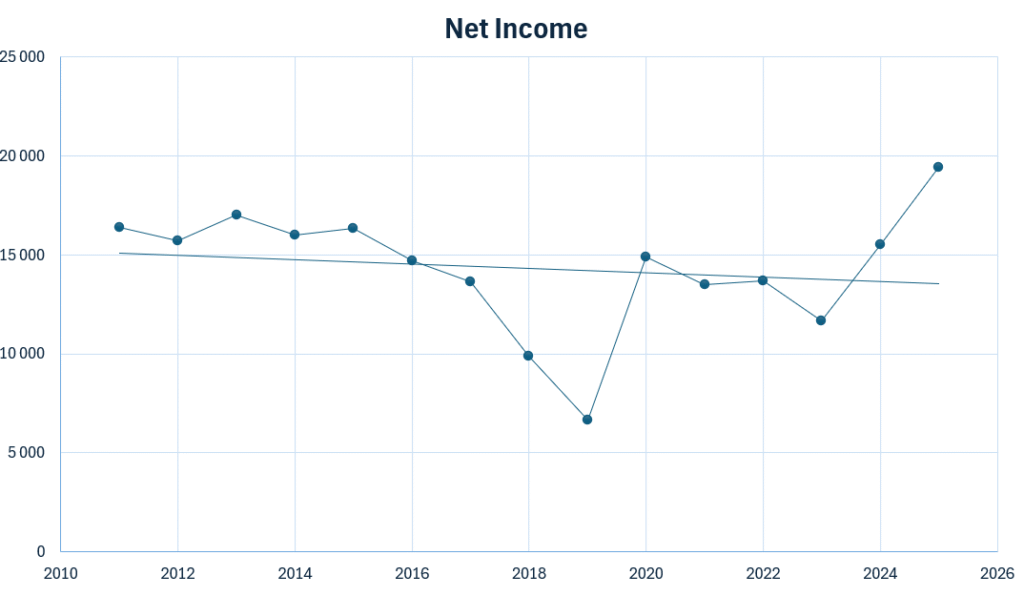
Illustration 11 and 12: Net Income for Target from 2011 to 2025

Net income is a crucial metric to evaluate when determining whether a company is a worthwhile investment. It represents a company’s net profit or loss after accounting for all revenues and income items. All expenses are deducted to calculate the net income as Net Income = Revenue – Expenses.

For Target, as illustrated in figures 11 and 12, several concerning trends appear in the development of net income. The decline in net income from 2011 to 2015 is a clear red flag. It signals operational and strategic challenges during those years. Rising operational expenses affected this period. Competition intensified significantly. The costly impact of Target’s unsuccessful Canadian expansion placed considerable pressure on profitability.

The net income remained flat between 2016 and 2020. There was no meaningful growth during this period. This lack of growth is also a negative sign. A prolonged lack of upward movement suggests stagnation in earnings. This is despite significant investments in digital transformation, store renovations, and supply-chain improvements.

The decline in net income from 2022 to 2023 is another notable warning signal. This drop was largely driven by sharp increases in freight, transportation, and inventory-related costs. Heavy markdowns were also a factor as Target attempted to correct excess inventory. Most significantly, the negative net income in 2015 marks a major red flag. Rising operating costs, margin compression, and persistent competitive pressure have culminated. This move into negative territory reflects these challenges.

Overall, Target’s net income trend raises concerns. The repeated declines (2011–2015 and 2022–2023), the prolonged stagnation (2016–2020), and the negative net income in 2015 collectively indicate that Target has faced significant profitability challenges. Persistent fluctuation without sustained growth is generally a negative sign for long-term financial health.

Revenue Breakdown

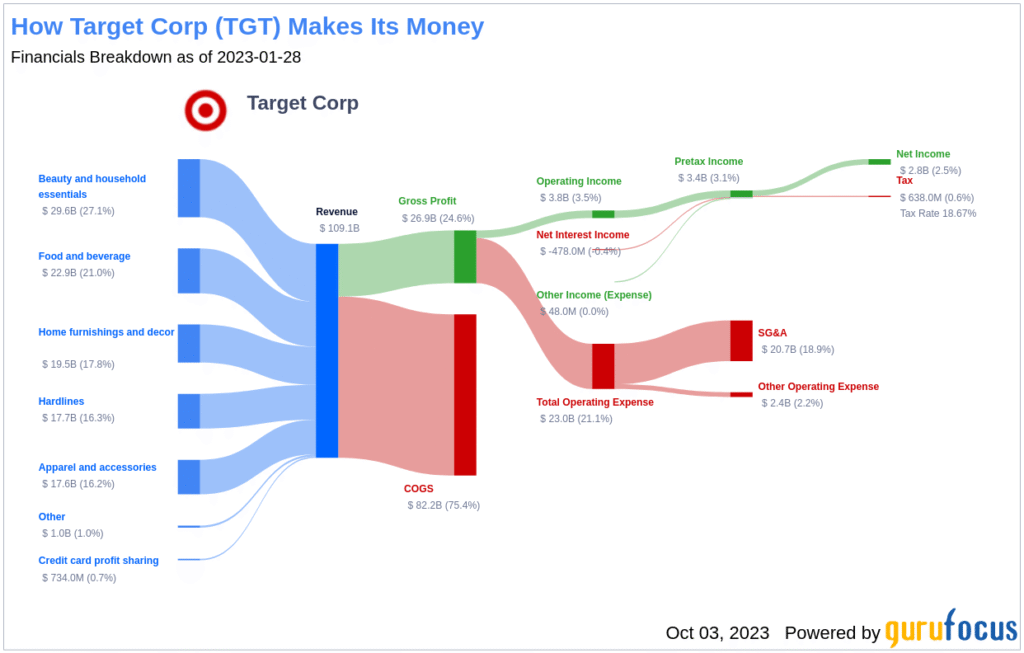
Illustration 13: Revenue breakdown of Target Corp., made by Gurufocus: Target (TGT)’s Hidden Bargain: An In-Depth Look at the 25% Margi

As shown in Illustration 13, Target’s revenue is driven primarily by its U.S. retail operations, as the company operates exclusively within the United States. Essentials & Beauty represents Target’s largest and most stable revenue contributors (around 27%). This category includes household essentials, personal care, cleaning supplies, and beauty products. Because these goods are purchased frequently, this segment provides Target with a reliable baseline of recurring revenue.

Food & Beverage is another major driver, accounting for around 21% share of overall revenue. . Although margins in grocery tend to be lower than in discretionary categories, the steady demand improves store traffic. Apparel & Accessories is one of Target’s historically strong segments and a key differentiator from many other big-box retailers. Target’s private-label apparel brands, combined with affordable pricing, drive strong seasonal demand. However, this category can be sensitive to shifts in consumer spending during inflationary periods. It can also be sensitive during recessionary periods. These conditions can lead to volatility.

Home contributes meaningfully to total revenue (17.8%) but has experienced fluctuations in recent years. After strong performance during the pandemic, demand softened as consumers shifted spending toward services and essentials. This cyclicality makes the Home category more volatile than Target’s other segments. Hardlines, which includes electronics, sporting goods, and toys, accounts for a smaller but still important portion of Target’s revenue. Performance in this segment tends to vary with product cycles and holiday-driven demand. Electronics, in particular, can generate high sales volatility depending on consumer trends and promotional activity.

On the cost side, cost of sales typically consumes a large share of Target’s revenue. This reflects the retailer’s competitive pricing strategy in a low-margin environment. Operating expenses, primarily wages, supply-chain costs, digital-fulfillment expenses, and ongoing store investments—make up most of the remaining cost base.

Earnings per share (EPS)

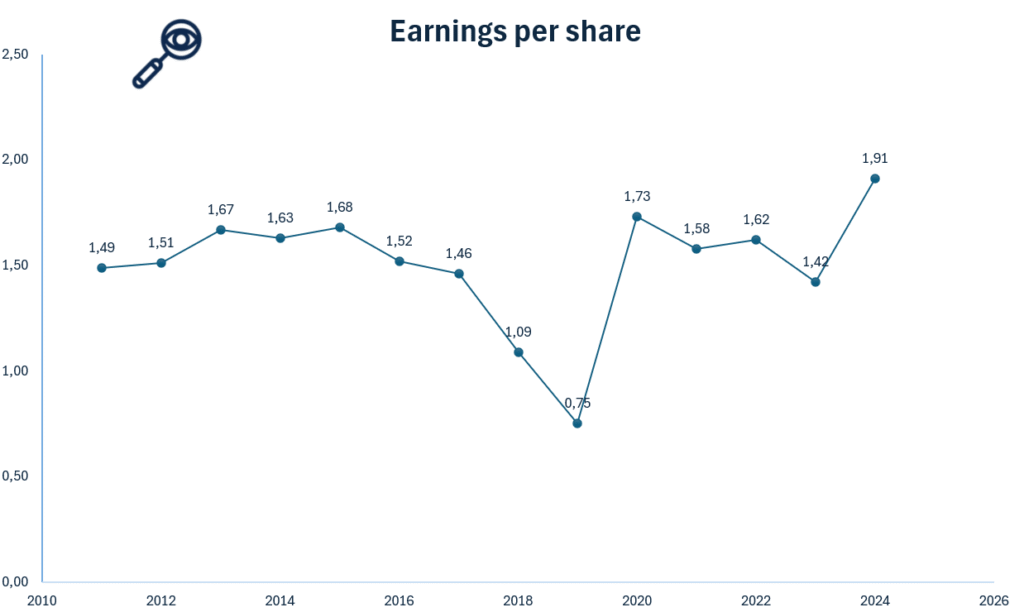
Illustration 14: EPS for Target Corp. from 2011 to 2025

Earnings Per Share (EPS) is a key financial metric. It shows how much profit a company generates for each outstanding share. It is a strong indicator of profitability, financial health, and long-term value creation. While the absolute EPS number matters less to value investors, the trend in EPS is crucial. A steadily rising EPS signals consistent profit growth and a strong underlying business.

For Target, the decline in EPS from 2013 to 2015 is a clear warning sign. This drop was largely driven by the company’s failed Canadian expansion, which resulted in significant operating losses, high exit costs, and considerable write-downs. These challenges placed heavy pressure on profitability and reduced Target’s earnings on a per-share basis.

The second notable dip, from 2022 to 2023, is also concerning. This decline reflects a combination of sharply rising supply-chain and freight costs, inventory costs and broader inflationary pressures. These factors strained margins and negatively affected earnings, even though revenues remained solid.

However, despite these dips, the overall long-term trend in Target’s EPS is positive. When viewed over a longer time horizon, EPS has generally moved upward. This is supported by strong private-label performance. More efficient store operations have also contributed. This upward trajectory suggests that Target has been able to recover from short-term setbacks and continue creating value for shareholders.

Assets and Liabilities

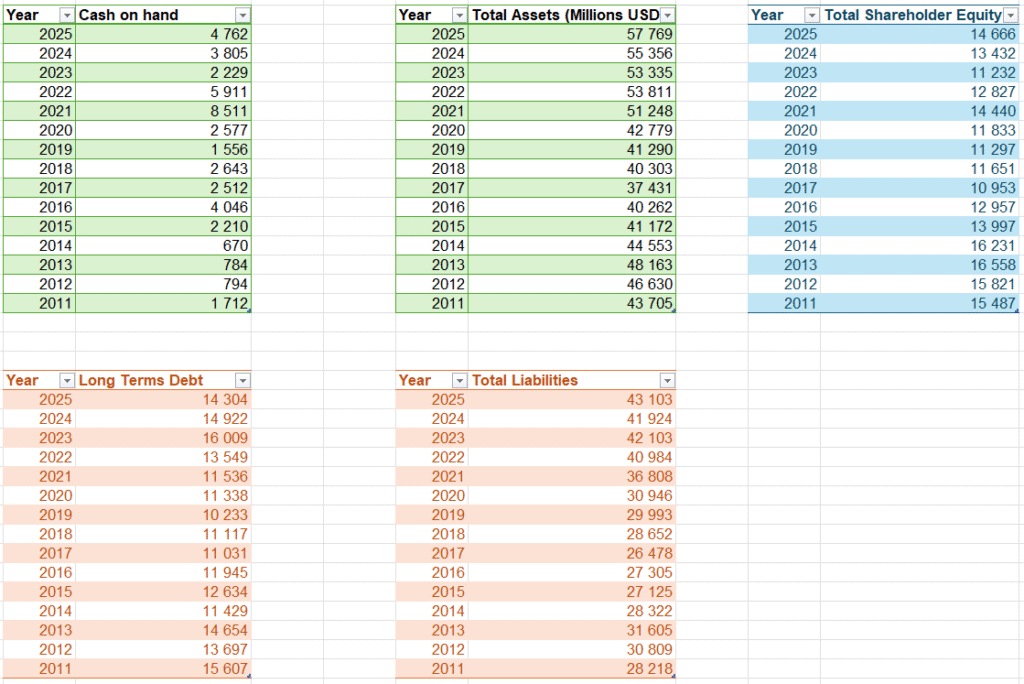
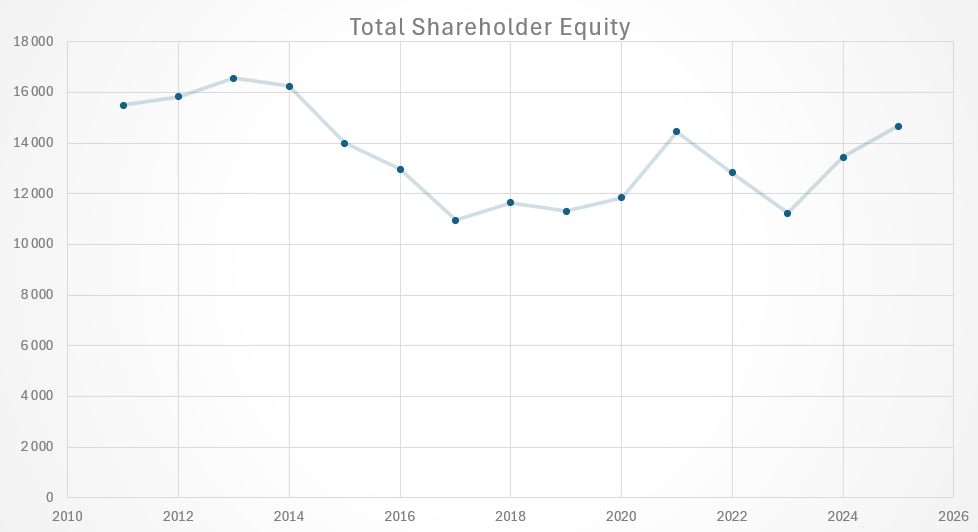
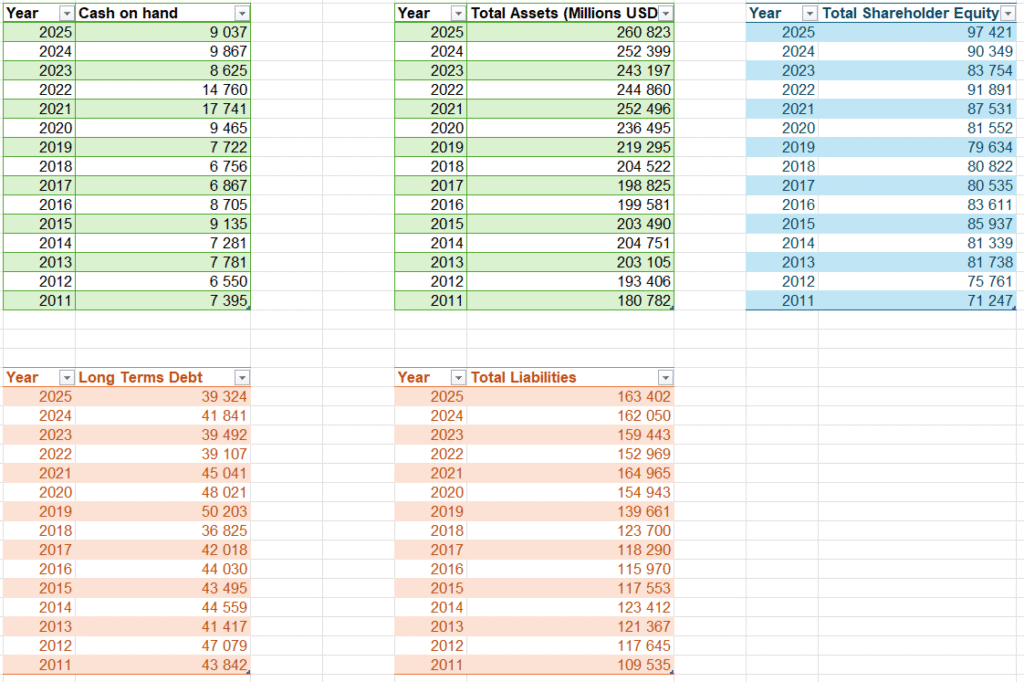
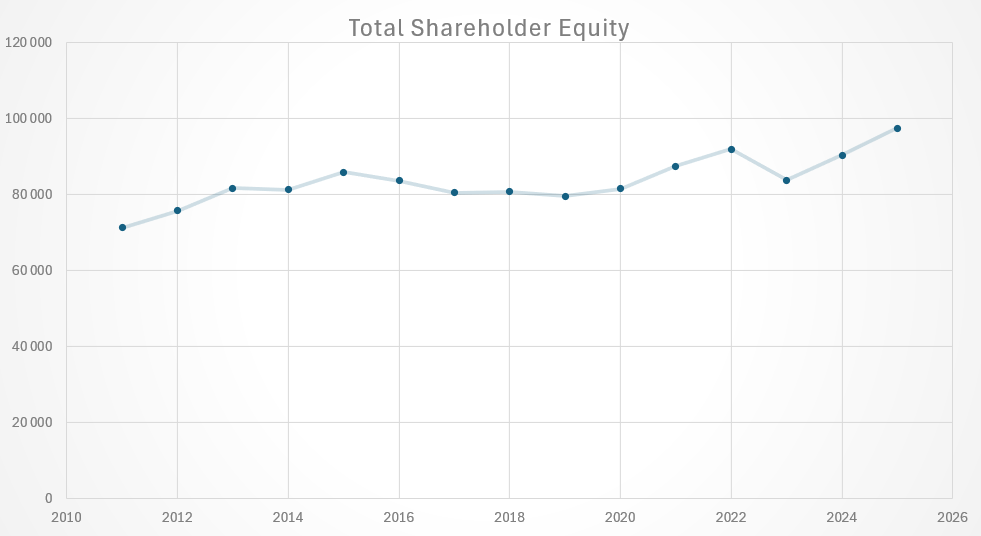
Illustration 15 and 16: Assets and Liabilities for Target from 2011 to 2025

When evaluating a company as a potential investment, understanding its assets and liabilities is essential. Just as you would assess the equity and assets of a local business before considering a purchase, the same logic applies. This also holds true when analyzing publicly traded companies like Target.

As shown in Illustrations 15, the downward trend in shareholder equity is the most concerning element. A declining equity base is a clear red flag, as it suggests that liabilities may be growing faster than assets. Illustration 15 shows that both total liabilities and assets have grown over time. However, assets are growing more slowly than liabilities. This can result from higher operating costs, inventory write-downs, margin pressures, or share buybacks exceeding retained earnings. Regardless of the specific cause, a sustained decline in equity weakens the company’s financial foundation. It reduces long-term value creation for shareholders.

The growth in Target’s total liabilities can also reflect investments in logistics, technology, inventory management and store modernization. Rising liabilities are not inherently negative, but they become more concerning when viewed alongside Target’s fluctuating cash on hand. Instead of showing a steady increase, cash levels have moved up and down year-to-year, signaling inconsistent liquidity management. More importantly, cash on hand is much lower than Target’s long-term debt. This creates a liquidity imbalance. It limits financial flexibility. It also increases reliance on external borrowing. This is a notable risk factor for investors.

Overall, Target’s balance sheet presents both strengths and significant caution points. Asset growth and ongoing investment in operational capabilities are positive. However, the decline in shareholder equity is a worrying sign. Fluctuating cash levels also raise concerns. Additionally, the large gap between cash on hand and long-term debt is something that investors should monitor closely.

Debt to Equity Ratio

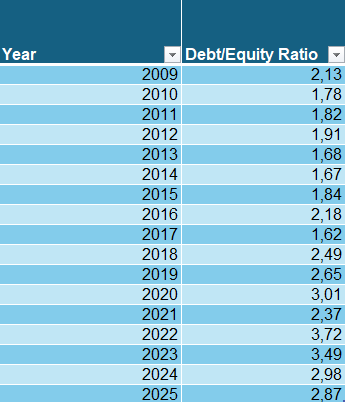
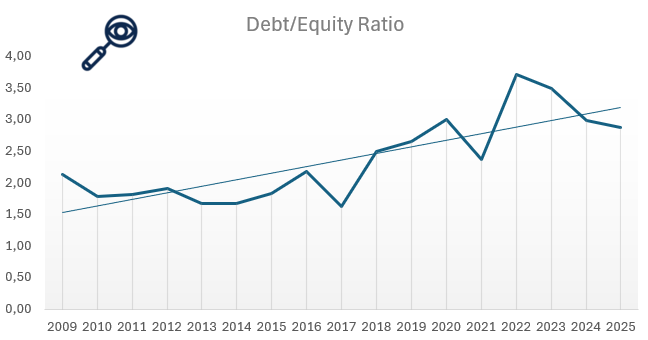
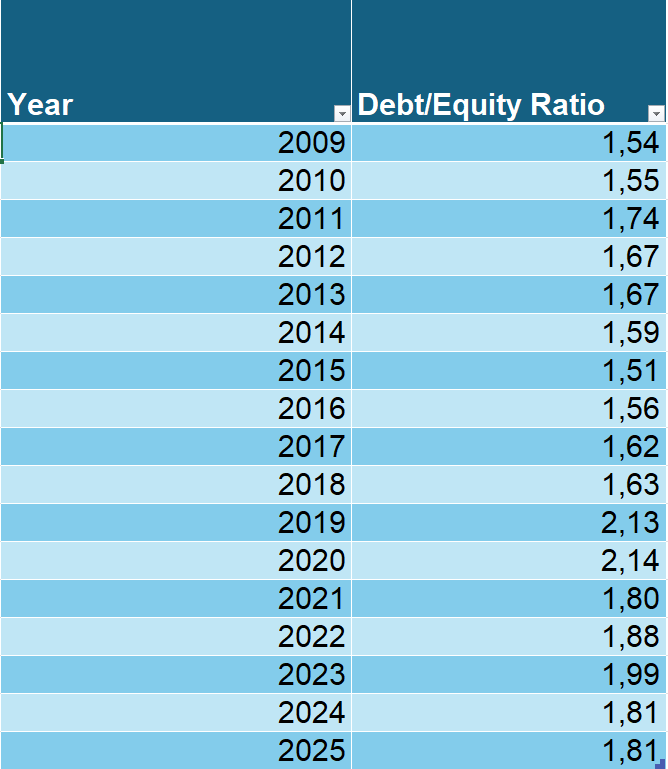
Illustration 17 and 18: Debt to equity ratio for Target from 2011 to 2025

The Debt-to-Equity (D/E) ratio is a key metric for assessing a company’s financial leverage and risk. It measures how much debt a company uses to finance its operations relative to shareholder equity. A higher D/E ratio indicates greater reliance on debt. This reliance can increase financial risk. This is especially true during economic downturns when meeting debt obligations becomes more challenging. Conversely, a lower D/E ratio suggests the company is primarily equity-financed, reducing risk but potentially limiting rapid growth opportunities.

Legendary value investor Warren Buffett generally prefers a debt-to-equity (D/E) ratio below 0.5. Walmart’s D/E ratio, however, stood at approximately 2.81 in 2025. For Target, the D/E ratio has shown a concerning upward trend over recent years, as can be seen in illustration 18. This rise indicates that Target is increasingly relying on debt to fund operations, store remodels, digital investments, and inventory management. While debt can accelerate growth, the steady increase in leverage is a negative sign. It exposes the company to higher financial risk if profitability or cash flow were to weaken.Target is gradually becoming more leveraged. Investors should monitor this situation closely. Continued increases in debt relative to equity could limit financial flexibility. They could also heighten vulnerability to economic shocks.

Price to earnings ratio (P/E)

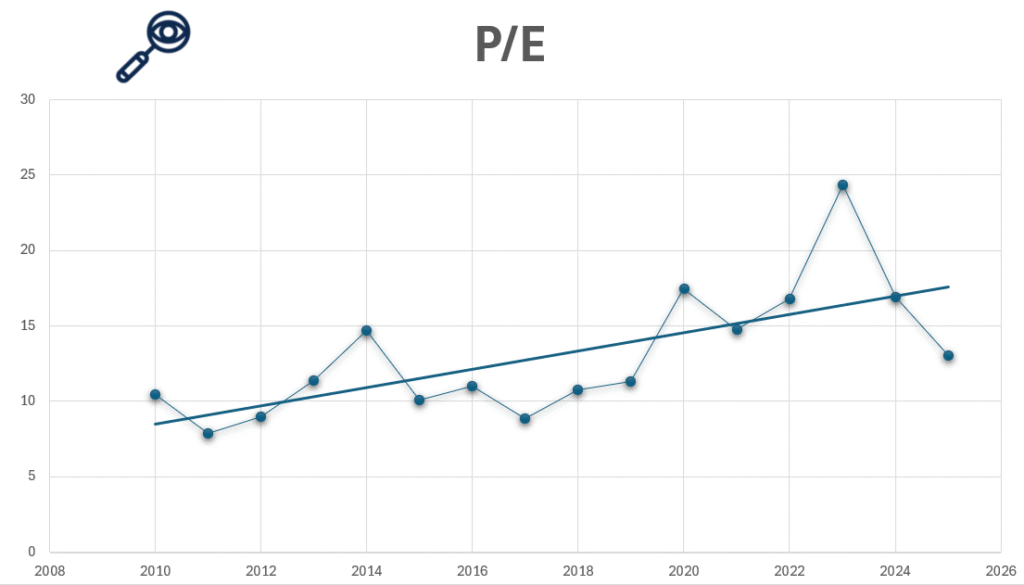
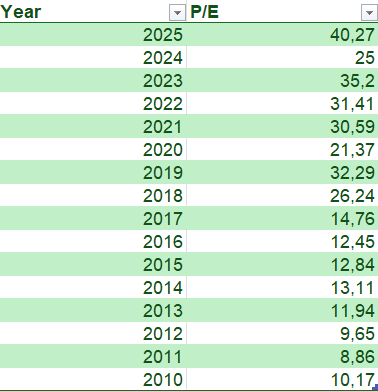
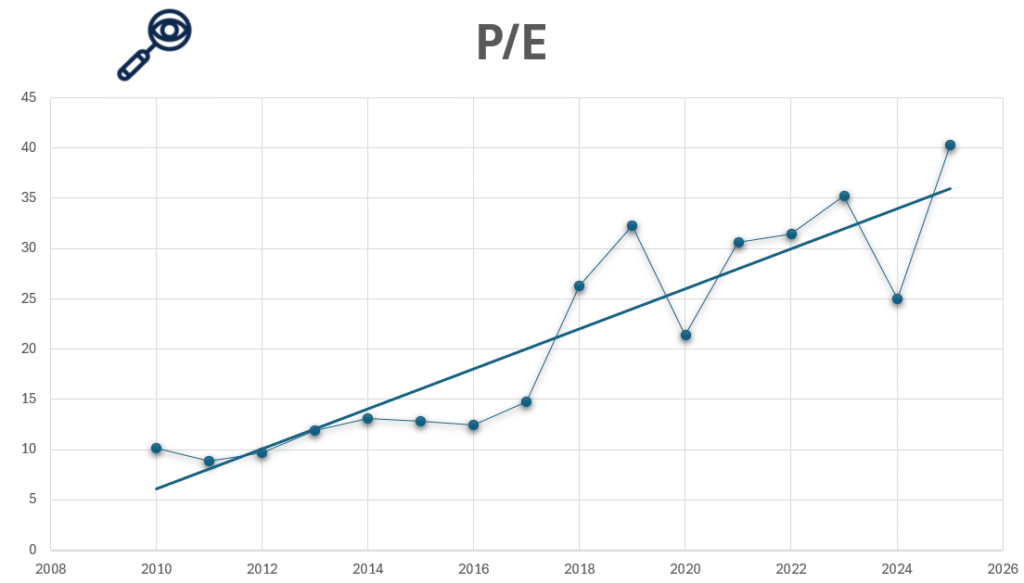
Illustration 19 and 20: P/E Ratio of Target from 2010 to 2025

For value investors, one of the most critical metrics when evaluating Walmart’s stock is the price-to-earnings (P/E) ratio, as it helps assess whether the company is undervalued or overvalued. Even if a company has strong financials, purchasing its stock at a high price can lead to poor returns. For example, imagine a business generating solid profits of $1 million per year. If the owner offers to sell you the business for just $1, it would be an incredible deal. But if the owner asks for $1 trillion, even though the business is profitable, the price would be absurdly overvalued. The stock market works similarly, companies can be priced cheaply on some days and excessively expensive on others.

Warren Buffett, a legendary value investor, typically considers stocks with a P/E ratio of 15 or lower as “bargains.” A high P/E ratio suggests that investors are paying a premium for the company’s earnings, expecting significant growth.

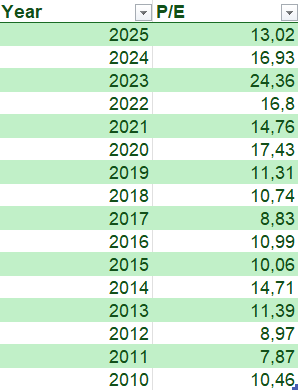
Target’s P/E has declined significantly in recent years. In 2023, it was around 24.36x, and as of 2025 it sits at about 13.02x, reflecting a substantial drop. This recent decline brings the stock back in line with its historical average P/E. Historically, it has generally ranged from 10x to 14x. Therefore, it is fairly valued from a long-term perspective.

The drop in P/E largely reflects a decrease in earnings per share (EPS). Target’s EPS fell from $14.10 in 2022 to $5.98 in 2023, which pressured the stock’s valuation and investor sentiment. The lower P/E indicates that the stock is no longer trading at a high premium. It also reflects recent earnings volatility. The challenges Target has faced include margin pressures, higher operating costs, and inventory management issues.

From a value-investor standpoint, the current P/E suggests that Target is now reasonably valued. The stock may even be modestly undervalued compared with both its recent peak and historical levels. This presents a potential entry point for long-term investors who believe the company can stabilize and grow earnings again. However, caution is warranted, as continued earnings volatility or macroeconomic pressures could make the stock less attractive. Overall, the recent dip in valuation makes Target’s stock more appealing than it has been in recent years. This aligns the price with its earnings. It creates a better opportunity for value-oriented investors.

Price to Book Value (P/B)

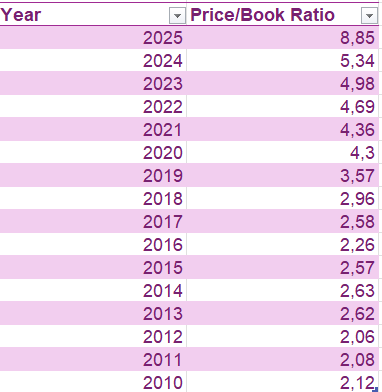
Illustration 21 and 22: Price to book value of Target from 2010 to 2025

The price-to-book (P/B) ratio compares a company’s market valuation to its book value. It essentially measures how much investors are paying for each dollar of shareholder equity. A lower P/B ratio can indicate that a stock is undervalued. This means investors are paying less for the company’s assets than they are actually worth. Conversely, a high P/B ratio suggest overvaluation or reflect investor expectations of strong future growth. This metric is often used by value investors to assess whether a stock is trading at a fair price relative to its underlying assets.

For Target, the recent decline in the P/B ratio from around 8.72x in 2022 to approximately 2.58x in 2025 is significant. This sharp drop largely reflects the company’s declining earnings. It also reflects shareholder equity pressures during this period. The pressures are driven by margin compression, higher operating and supply-chain costs, and inventory challenges. The drop was initially a warning sign. Now, the resulting low P/B suggests that Target is trading well below its historical valuation levels. This makes the stock appear undervalued from a value-investor perspective.

At the current P/B of roughly 2.58x, the stock is much closer to the range typically favored by value investors, such as Warren Buffett, who often seeks P/B ratios near or below 2x. This indicates that the market is pricing Target’s shares more in line with the company’s actual assets, rather than speculative growth expectations. The recent dip has stemmed from operational and margin pressures. However, it has created a potential opportunity for long-term investors. Now, the stock is trading at a discount relative to its book value and historical norms.

Return on Investment (ROI)

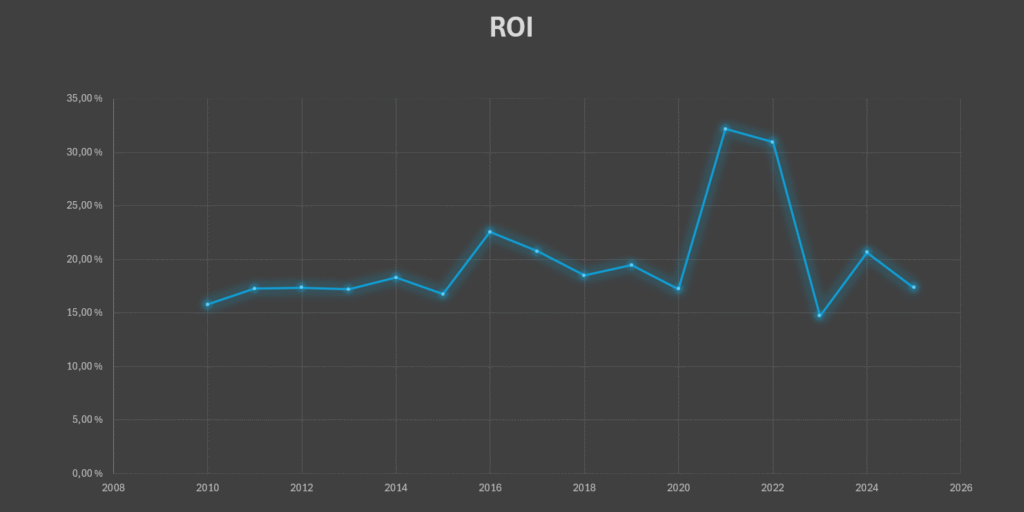
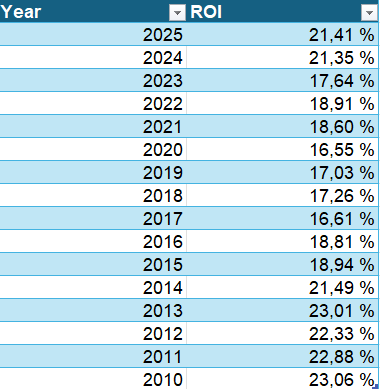
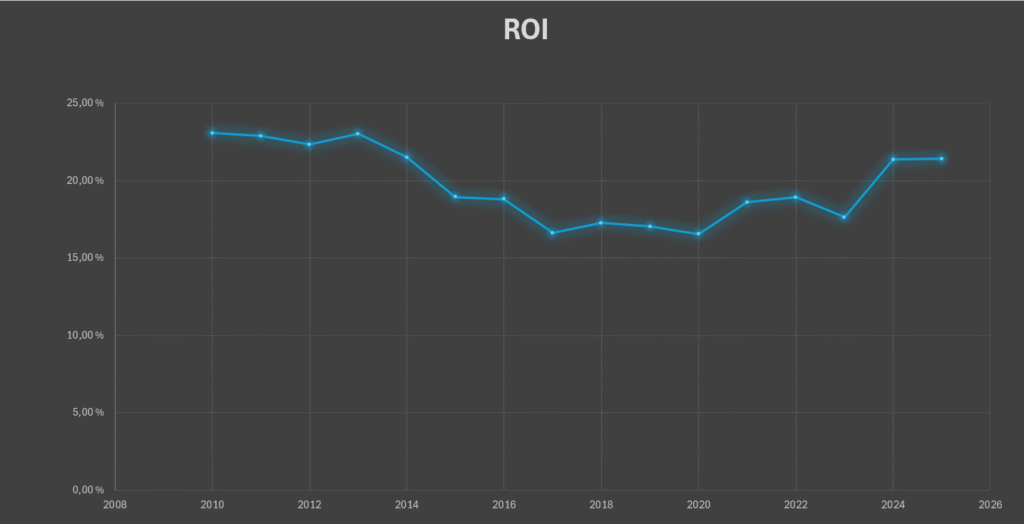
Illustration 23 and 24: ROI for Target from 2010 to 2025

For value investors, Return on Investment (ROI) is a key metric for evaluating Target, as it shows how efficiently the company is using its capital to generate profits. A strong ROI shows that Targetgenerates solid returns compared to the capital it deploys. This makes Target an attractive investment, even if the absolute revenue numbers are large.

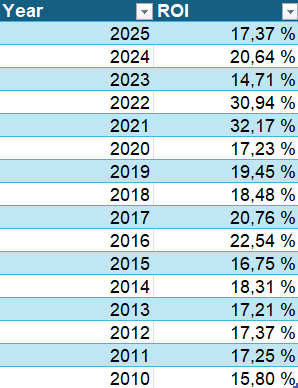
Target’s ROI has historically been modest compared with some of its peers. From 2010 to 2020, ROI hovered around 15–20%, reflecting moderate efficiency in its operations and capital deployment. In 2021, ROI spiked sharply to approximately 32%. This increase was largely due to strong sales growth. Higher margins during the post-pandemic retail boom also contributed. Additionally, effective cost management played a role. This temporary surge highlighted Target’s ability to generate excellent returns when market conditions and operational execution align.

However, this improvement proved short-lived. From 2022 through 2024, ROI declined steadily back to around 15%, driven by rising supply-chain and freight costs, margin pressures from heavy markdowns, and higher operating expenses. These factors significantly reduced the efficiency of Target’s invested capital. The lower ROI underscores that, despite strong revenue, the company has struggled to translate sales into proportional returns on investment.

Overall, Target’s ROI remains relatively low, which is a cautionary sign for investors focused on capital efficiency. While the sharp increase in 2021 demonstrated the company’s potential under favorable conditions, the subsequent decline highlights ongoing operational challenges and the need for careful cost and capital management. From a value-investor perspective, the low ROI suggests that returns on invested capital are limited, even though recent strategic initiatives in supply-chain optimization and digital expansion could help improve efficiency over time.

Dividend

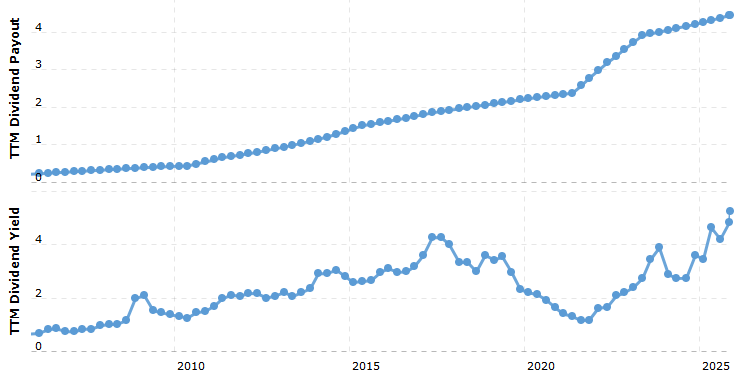
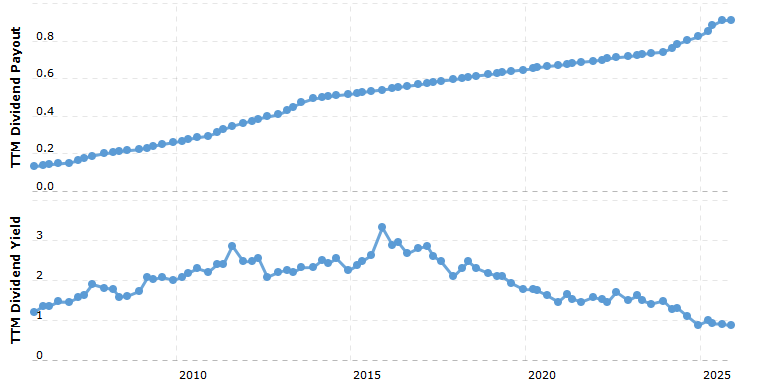
Illustration 25: Target Dividend Yield and dividend payout ratio from 2005 to 2025.

Target currently pays an annual dividend of $4.56 per share, resulting in a yield of approximately 5.45%, with a payout ratio around 55–60%. This moderate payout ratio shows that the dividend is reasonably sustainable. It also allows the company to retain a significant portion of earnings for operational needs, store remodels and inventory management. Additionally, it supports growth initiatives such as digital and supply-chain expansion.

The relatively high yield is attractive for income-focused investors. However, it also reflects some market caution regarding Target’s earnings volatility. Additionally, there have been margin pressures in recent years. Despite this, Target has a long history of consistent dividend payments. It has modest, steady increases. This demonstrates a commitment to returning value to shareholders.

Overall, Target’s dividend profile is a green flag. The dividend is generous and covered by earnings. It provides a reliable income stream. Meanwhile, the company maintains sufficient retained earnings to support ongoing investments.

Insider Trading

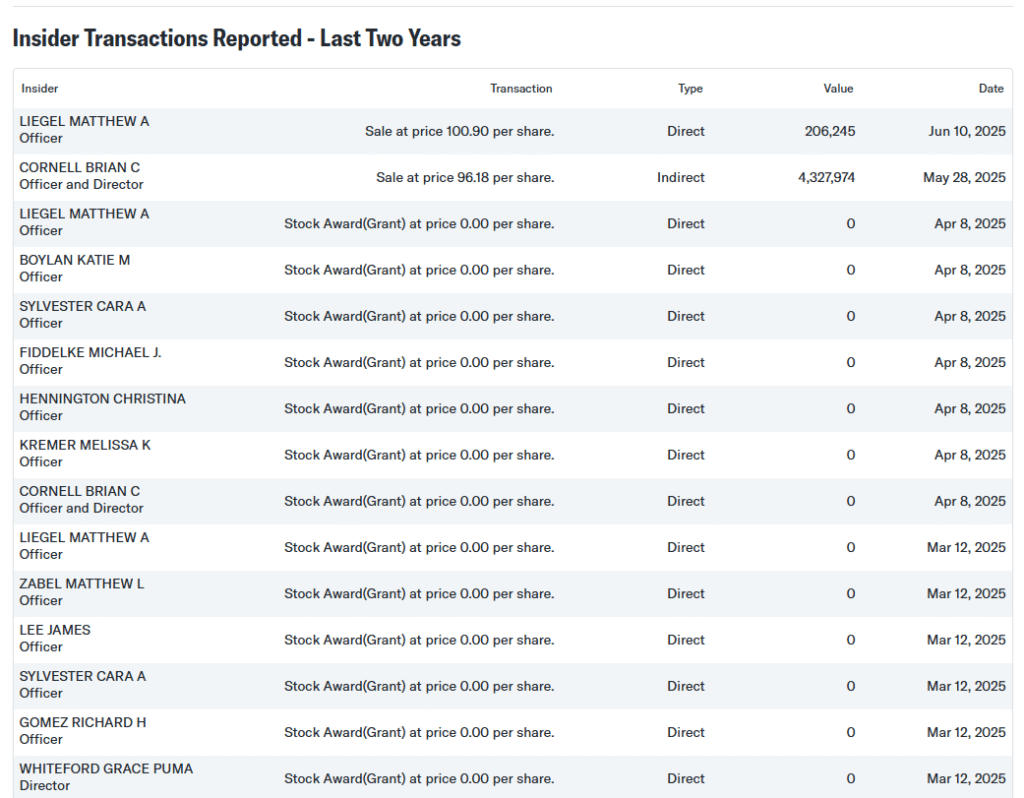
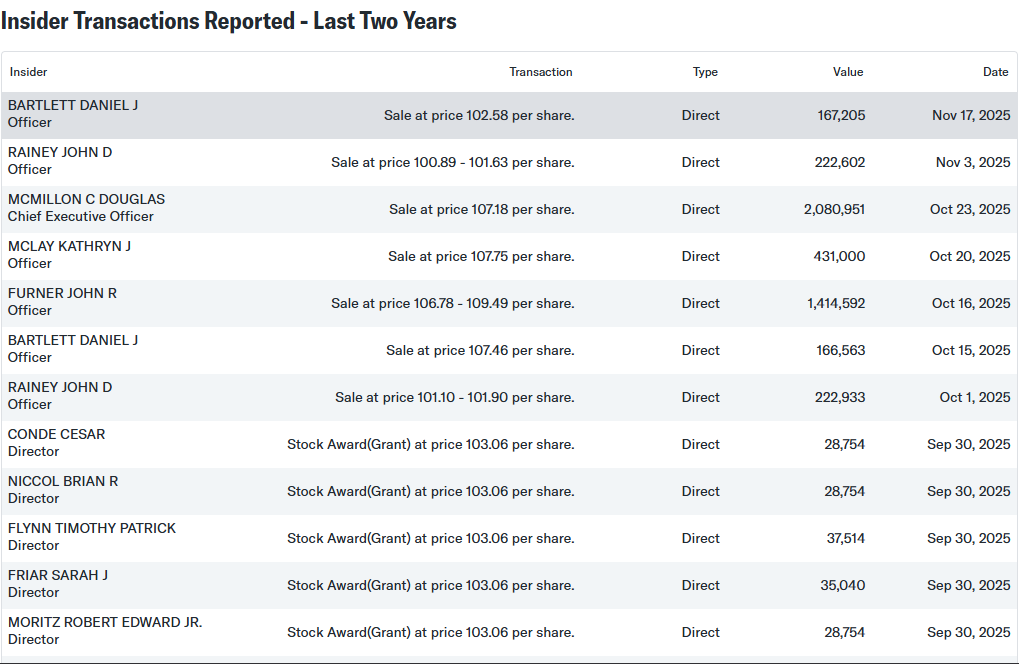
Illustration 26: Most recent insider trading at Target, gathered from Target Corporation (TGT) Recent Insider Transactions – Yahoo Finance. Please consult yahoo finance for most recent list.

In recent months, Target insiders have sold a significant amount of stock, which can be considered a red flag for investors. CEO Brian Cornell sold approximately 45,000 shares at an average price of $96.18, worth over $4 million. Chief Accounting Officer Matthew Liegel also sold shares during the same period. Most of these sales were conducted under prearranged Rule 10b5‑1 trading plans, which allow insiders to sell shares according to a pre-approved schedule. The scale of these transactions is notable. It could signal that insiders may have concerns about the near-term upside of the stock.

Rule 10b5‑1 plans reduce the likelihood that trades reflect a sudden loss of confidence. Despite this, the combination of large insider sales and relatively modest insider ownership in Target suggests caution. It may indicate that key executives are taking profits while the stock price is elevated, which can be a warning sign for potential investors. Target’s insider trading policy requires trades to occur during open windows and under pre-approved plans, providing governance oversight. However, the recent activity still highlights that insiders are reducing their exposure.

Other Company info

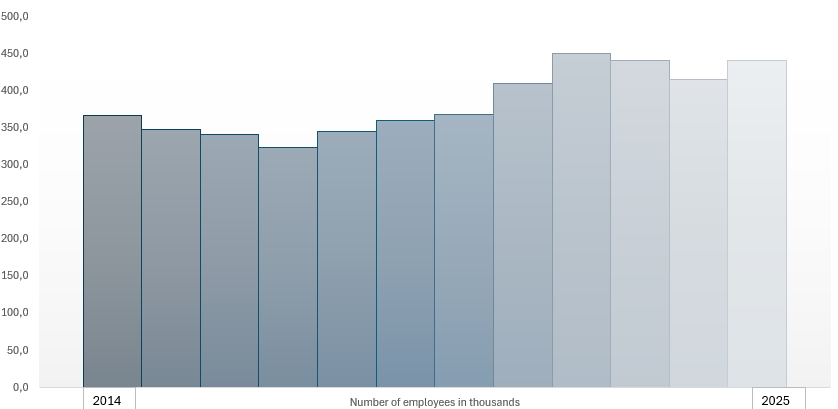
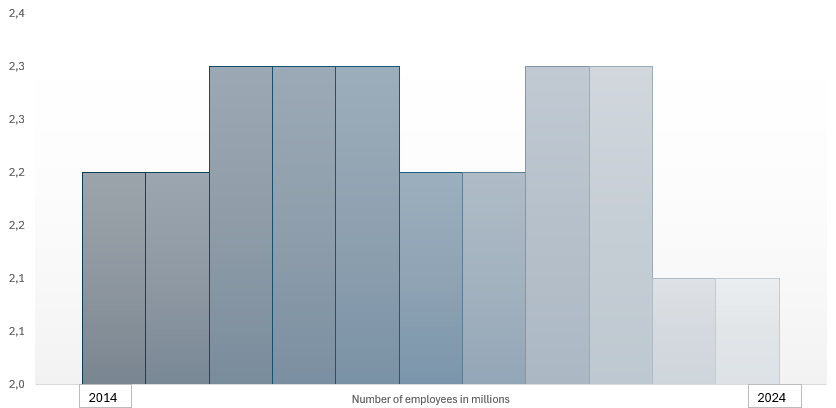
Founded in 1902, Target Corporation is one of the largest and most recognized retail chains in the United States, known for its combination of affordable products, stylish merchandise and growing e-commerce presence. As of 2024, Target employs approximately 450,000 people across its stores, distribution centers, and digital operations. The company is publicly traded on the New York Stock Exchange under the ticker symbol TGT and operates within the Consumer Discretionary sector, specifically in the Retail—Discount Stores industry.

Target is headquartered at 1000 Nicollet Mall, Minneapolis, Minnesota, USA. As of 2024, the company has roughly 496 million shares outstanding, with a market capitalization of around $95 billion USD. For more information, visit Target’s official website: https://corporate.target.com

Illustration 27-29: Number of employees and location of Target Corp.

Final Verdict

Overall, Target is not recommended as a value investment at this time. While the stock may appear reasonably priced, recent declines in sales, lowered earnings guidance, its reduced shareholder equity, fluctuating revenue, low ROI, high debt to equity ratio and net income and notable insider selling suggest caution.

Competitive pressures and operational challenges in the retail sector limit upside potential. This situation makes Target a red flag for long-term investors, even though it has a strong brand and solid operations.

Walmart: Stock Analysis (Nov. 2025)

Introduction

Walmart Inc. stands as one of the most powerful and transformative companies in modern economic history. What began as a single discount store in rural Arkansas has grown into the world’s largest corporation. The everyday shopping habits of hundreds of millions of people is influenced by Walmart.

Walmart Logo Redesign

Illustration 1: The Walmart Spark, a symbol that represents affordability, low prices and accessibility.

Walmart is far more than a place to buy groceries or home goods. It is a global entity operating on a scale that few companies in any industry have ever achieved.

From its headquarters in Bentonville, Arkansas, Walmart oversees thousands of stores. It manages massive distribution networks. Walmart has one of the most sophisticated supply chains on Earth.

The company’s guiding philosophy, known as Everyday Low Prices, revolutionized retail by combining relentless cost discipline with unparalleled operational efficiency.

Traditional retailers expanded cautiously. Meanwhile, Walmart pushed forward with aggressive store openings. It engaged in tight supplier negotiations and made investments in logistics technology. These strategies allowed it to dominate markets across the United States.

Today, Walmart operates e-commerce platforms, digital marketplaces, and financial services. It also manages last-mile delivery systems, robotics labs, and one of the world’s largest private trucking fleets. With its increasing emphasis on data, automation and online retail, Walmart continues to redefine the future.

History

The Walmart story began in 1962 when Sam Walton opened the first Walmart Discount City store in Rogers, Arkansas. His core belief was that customers should have access to quality goods at the lowest possible prices. This philosophy set Walmart apart from competitors at a time when discount stores were seen as low-quality alternatives.

The Origin of Wal-Mart: Five and Dime to Superstore - Shortform Books

Illustration 2: First Wall Mart opened in Rogers, Arkansas


Walton’s approach quickly attracted loyal shoppers, especially in underserved rural areas where Walmart filled a significant retail gap.

During the 1970s and 1980s, Walmart expanded throughout the American South and Midwest. It built a formidable network of stores. This network was supported by a logistics system. This system would become one of its greatest strengths.

Shopper pushes a basket into the produce section of a Walmart store in Englewood, Colo.

Illustration 3: A classical Walmart Store in Englewood, Colo

When the company introduced Walmart Supercenters, it combined general merchandise with full grocery departments. Walmart then became the dominant grocery retailer in the United States. It holds this position overwhelmingly to this day.

The 1990s marked Walmart’s international expansion, beginning with Mexico and Canada followed by ventures into Asia, South America and Europe. Some markets proved challenging. Yet, Walmart’s global presence remains significant. Millions of customers visit its stores and online platforms every day.

The company’s greatest transformation came in the 2010s and 2020s, when it invested heavily in e-commerce through acquisitions such as Jet.com and Flipkart in India and by building its own digital infrastructure to compete directly with Amazon.

Today, Walmart operates over 10,000 stores across multiple continents, employs more than two million people and consistently ranks among the world’s most influential and valuable companies.

Operations

Global Presence

Walmart’s operations span thousands of physical stores in various formats, including Supercenters, Neighborhood Markets, and Sam’s Club warehouse stores. It also runs a rapidly growing international division with strong presences in Mexico, Central America, India, and other regions.

More than 240 million customers visit Walmart stores and websites every week. They rely on the company for groceries, apparel, electronics, home essentials, pharmaceuticals, and countless other products.

The scale at which Walmart operates is staggering. It handles immense volumes of goods from suppliers around the world, manages advanced transportation systems and depends on real-time data. Its U.S. network is vast. Most Americans live within a short drive of a Walmart. This gives the company a unique advantage.

E-Commerce and Digital Transformation

Although Walmart built its empire through physical retail, the company has undergone a dramatic digital transformation over the past decade. It now operates one of the largest e-commerce platforms in the United States. The company is rapidly expanding in online grocery delivery, general e-commerce and third-party marketplace sales.


Walmart’s membership program, known as Walmart Plus, provides customers with fast delivery. It offers fuel discounts and various digital conveniences. These conveniences integrate online and in-store shopping.

Robo-Forklifts Rev Up Walmart's Warehouses

Illustration 4: A automated Walmart distribution center with robo-forklifts. Image gathered from: Robo-Forklifts Rev Up Walmart’s Warehouses

The company is also building automated fulfillment centers inside or adjacent to existing stores. They use robotics and machine learning to improve picking speed and reduce costs. This helps fulfill orders within hours.

Walmart employs thousands of engineers, data scientists and technology specialists. They work on advanced inventory systems, artificial intelligence, cybersecurity and cloud architecture. Its growing network of micro-fulfillment centers shows Walmart’s ambition. The company aims to become a digital and technological powerhouse. It wants to rival the world’s leading tech giants.

Supply Chain Dominance

Walmart’s supply chain is often described as one of the greatest business achievements of the modern era.

The company pioneered real-time inventory tracking, satellite-linked store communication and massive automated distribution hubs long before competitors embraced similar technologies.

Its private truck fleet is among the largest in the world. Walmart’s centralized procurement operations allow them to negotiate favorable terms with suppliers. This often influences manufacturing standards, packaging, and pricing across entire industries.

This logistics mastery allows Walmart to move goods efficiently, reduce waste, and keep prices lower than most competitors. The company’s distribution network connects thousands of suppliers to millions of customers with remarkable speed and accuracy. This connection creates a competitive advantage. It has proven extremely difficult for rivals to replicate.

Walmart Eases Supplier Delivery Demands as Stocking Pressures Recede - WSJ

Illustration 5: A Walmart truck, walmart has one of the largest truck fleets in the world (image gathered from: Walmart Eases Supplier Delivery Demands as Stocking Pressures Recede – WSJ).


Key Competitors

Walmart operates in a highly competitive retail environment, with Amazon as its strongest rival. Amazon leads in e-commerce, cloud services, and digital innovation. In contrast, Walmart excels in physical retail and groceries. This creates an ongoing battle between scale and technology.

New Target Stores and Facilities

Illustration 6: Target is growing competitor (Image from New Target Stores and Facilities).

Target competes by focusing on curated products and a stylish customer experience, appealing to shoppers who value design.

Costco remains a major force through its membership model and strong loyalty, pushing Sam’s Club to keep improving. Traditional grocers like Kroger and Albertsons challenge Walmart on fresh food and store quality. Global retailers such as Carrefour, Aldi, Tesco and Alibaba leverage regional strength. They also use advanced digital tools.

Dollar General and Dollar Tree add pressure at the extreme value end. They are expanding into areas where Walmart’s larger stores don’t fit. Together, these competitors force Walmart to continuously refine pricing, logistics, and its overall shopping experience.

Competitive Advantages

Walmart’s greatest advantage is scale. Its purchasing power and extensive distribution network allow it to secure low costs and maintain everyday low prices.

The company’s supply chain is supported by automation and AI. Real-time inventory systems also play a role. Together, they make it one of the most efficient in the world.

Walmart has a powerful position due to its nationwide store network. It blends physical stores with services like curbside pickup. It also offers same-day delivery. This reach is difficult for online-only competitors to replicate.

Walmart’s financial strength enables sustained investment in technology, store upgrades and new services. Its long-standing reputation for value and convenience continues to build loyalty, especially during economic downturns.

Walmart is betting big on new technology. But can it deliver where others  haven't? | CNN Business

Illustration 7: Walmart has made a bug bed on new technology (image from Walmart is betting big on new technology. But can it deliver where others haven’t? | CNN Business)

Ongoing investments in digital tools and automation ensure Walmart remains competitive. Retail is increasingly shifting toward speed, convenience, and technological integration.


Stock Analysis

In this section we will analyze Walmart’s stock to see if it is a good stock to buy or not. Our philosophy is value investing meaning that we try to find good quality companies that are undervalued. However, we will give a holistic overview. This allows all kinds of investors with different philosophies to judge the stock for themselves.

Revenue and Profits

Illustration 8 and 9: Revenue of Walmart from 2011 to 2025

As shown in Illustrations 8 and 9, Walmart has maintained steady revenue growth. It went from around USD 421 billion in 2010 to around 680 billion in 2025. There were no major spikes or declines. This smooth upward trajectory is a strong green flag, indicating that Walmart has a sound business strategy and now how to deliver long-term and not only short-term.

Walmart’s revenue dipped between 2015 and 2016 mainly because a strong U.S. dollar reduced the value of its international sales, even though customers abroad were still spending. At the same time, Walmart closed underperforming stores in markets like Brazil and China, and made major price cuts in the U.S. to stay competitive, which lowered the amount earned per sale.

Overall, Walmart’s financial performance is a green flag for value investors as it shows a company that is stable, has increased its revenue steadily over time and been able to grow and handle crisis.

Illustration 10 and 11: Net Income for Walmart from 2011 to 2025

Net income is a crucial metric to evaluate when determining whether a company is a worthwhile investment. It represents a company’s net profit or loss after accounting for all revenues and income items. All expenses are deducted to calculate the net income as Net Income = Revenue – Expenses.

For Walmart, as seen in illustration 10 and 11, the steady decline in net income from 2011 to 2019 and again from 2020 to 2023 is a notable red flag. This decline signals rising operating costs and heavy price cuts to stay competitive. Increased labor and wage expenses have further impacted the margins. Additionally, significant investments in e-commerce and logistics weighed on their margins. These years show that even with strong sales, profitability was under pressure.

However, the renewed growth in net income from 2023 to 2025 is an encouraging development. It demonstrates that Walmart’s efficiency measures are finally boosting earnings again. Supply-chain improvements and a maturing online ecosystem are also strengthening the company’s overall financial outlook.

Overall, the net income of Walmart is a negative sign as it has been a steadily negative trend that showcases the heavy competitive environment Walmart operates in. However, the recent upwards trend from 2023 to 2025 is a good sign.

Revenue Breakdown

OC] How Walmart makes its Billions: Income statement visualized :  r/dataisbeautiful

Illustration 12: Revenue Breakdown for Walmart

As shown in Illustration 12, Walmart U.S. remains the company’s largest revenue driver, consistently generating over 65% of total revenue. This segment includes its core supercenters, neighborhood markets and rapidly expanding e-commerce operations.

Walmart International contributes roughly 20–25% of revenue, driven by operations in Mexico, Canada, China and other key markets. International stores provide meaningful geographic diversification. However, this segment has been sensitive to foreign exchange fluctuations. It also faces competitive pressures and restructuring costs. These factors have occasionally weighed on overall revenue growth.

Sam’s Club, Walmart’s membership-based warehouse chain, accounts for about 10–12% of total revenue. Sam’s Club has shown strong growth in membership fees. Private-label brands and omnichannel offerings also contribute to this growth. These factors help Sam’s Club provide a steady, higher-margin contribution relative to traditional retail sales.

On the cost side, cost of sales typically consumes around 75% of total revenue, reflecting Walmart’s high-volume, low-margin retail model. Operating expenses, including wages, logistics, technology investments, and store operations, take up most of the remainder. These cost pressures help explain Walmart’s historically thin margins and why net income can decline even when revenue remains stable.

Overall, Walmart’s revenue structure reflects a blend of scale, diversification and operational intensity. Walmart U.S. provides consistency. International adds global reach. Sam’s Club offers higher-margin membership growth. Together, these elements create a broad but cost-sensitive revenue foundation for the company.

Earnings per Share (EPS)

Illustration 13: Earnings per share (EPS) for Walmart from 2011 to 2025

Earnings Per Share (EPS) is a key financial metric that measures a company’s profitability on a per-share basis. It indicates how much profit a company generates for each outstanding share of its stock. This metric is used to assess a company’s financial health, profitability and potential for growth. In other words this metric can tell us how profitable the business is.

The EPS figure itself isn’t the primary focus for value investors, it can be 0.2 or 10, but what truly matters is the company’s ability to generate consistent earnings growth. A steadily increasing EPS over time signals strong financial health, profitability and long-term value creation.

In Walmart’s case, the decline in EPS from 2013 to 2019 and again from 2020 to 2023 is a clear red flag. This reflects rising wage and operating costs. It also shows price cuts to stay competitive, heavy investments in e-commerce and logistics and weaker performance in several international markets. All of these factors pressured margins and reduced per-share profitability. These periods show that Walmart was spending more to maintain market share while generating less profit per share. However, the renewed EPS increase from 2023 to 2025 is a positive sign. This suggests that its investments in automation, supply-chain efficiency and digital integration are finally paying off. This is encouraging for long-term investors.

Assets and Liabilities

Illustration 14 and 15: Assets and Liabilities for Walmart from 2011 to 2025

When evaluating a company as a potential investment, understanding its assets and liabilities is crucial. If a local business owner offered to sell their shop to you, one of the first questions, after determining its profitability, would be about its equity and assets. The same principle applies when assessing publicly traded companies like Walmart.

As shown in illustration 14 and 15, Walmart’s total assets have increased steadily from 2011 to 2025 from around 180,7 billion in 2011 to 260,8 in 2025. This trend is a positive sign. However, the flat and sluggish period in asset growth between 2015 and 2020 raises concerns. It indicates several years of limited expansion and investment. This occurred despite rising competition and industry changes.

Walmart’s total liabilities have also grown over time, driven by investments in digital infrastructure, international restructuring and operational modernization. Rising liabilities are not inherently negative. However, they require careful monitoring. This is especially true since Walmart’s cash on hand has declined from 2021 to 2025. It is a worrying sign that reduces financial flexibility. It also limits the company’s ability to absorb shocks or fund large projects without additional borrowing. Cash on hand remains significantly lower than Walmart’s long-term debt. This creates a liquidity imbalance that investors should watch closely.

On a more positive note, total shareholder equity has increased meaningfully from 2011 to 2025. This indicates that Walmart is building value over time. It is also strengthening its financial foundation. This upward trend in equity shows that the company’s asset base is growing faster than its liabilities. This is generally a green flag for long-term financial health. However, the flat period in equity between 2015 and 2020 shows years where Walmart’s financial progress stalled. It highlights the importance of monitoring how effectively future investments translate into real value creation. Overall, Walmart’s balance sheet shows both strengths and caution points. Growing assets and rising equity are positive. However, declining cash levels and high long-term debt require careful attention from investors.

Debt to Equity Ratio

Illustration 16 and 17: Debt to Equity ratio for Walmart from 2009 to 2025

The Debt-to-Equity (D/E) ratio is an important financial metric for assessing a company’s financial leverage and risk. It compares the amount of debt the company uses to finance its operations relative to its shareholder equity. A high D/E ratio suggests that the company relies more heavily on debt to fuel growth, which could increase financial risk, especially during economic downturns when managing debt obligations becomes more challenging. In contrast, a lower D/E ratio indicates that the company is primarily financed through equity, reducing financial risk but potentially limiting its ability to rapidly expand.

Legendary value investor Warren Buffett generally prefers a debt-to-equity (D/E) ratio below 0.5. Walmart’s D/E ratio, however, stood at approximately 1.81 in 2025. Walmart’s D/E ratio has been increasing over time. This is a negative sign as it indicates growing financial leverage and higher reliance on debt to fund operations and investments. That said, the ratio has remained around a relatively stable level, suggesting that while debt is rising Walmart has maintained some balance between borrowing and equity. Investors should monitor this carefully as sustained increases in leverage could pose risks if cash flow or profitability weakens. However, the stability of the ratio over time provides some reassurance that Walmart is managing its debt prudently.

Price to earnings ratio (P/E)

Illustration 18 and 19: P/E Ratio of Walmart from 2010 to 2025

For value investors, one of the most critical metrics when evaluating Walmart’s stock is the price-to-earnings (P/E) ratio, as it helps assess whether the company is undervalued or overvalued. Even if a company has strong financials, purchasing its stock at a high price can lead to poor returns. For example, imagine a business generating solid profits of $1 million per year. If the owner offers to sell you the business for just $1, it would be an incredible deal. But if the owner asks for $1 trillion, even though the business is profitable, the price would be absurdly overvalued. The stock market works similarly, companies can be priced cheaply on some days and excessively expensive on others.

Warren Buffett, a legendary value investor, typically considers stocks with a P/E ratio of 15 or lower as “bargains.” A high P/E ratio suggests that investors are paying a premium for the company’s earnings, expecting significant growth.

Walmart’s P/E has risen sharply over time, it was only 10.17 in 2010, first crossed 20 in 2018, and as of recent years sits around 40.27. This rapid increase suggests that the stock may be significantly overpriced, with investors paying a large premium for Walmart’s earnings based on expectations of growth. Such a high P/E ratio is a cautionary sign for value investors. It indicates that while Walmart is a financially strong and stable company, its current market price may not provide the attractive entry point that lower P/E levels once offered.

Price to Book Ration (P/B)

Illustration 20 and 21: Price to book ratio for Walmart from 2010 to 2025

Price‑to‑book value (P/B ratio) compares a company’s market valuation (its stock price) to its book value (equity on the balance sheet). A lower P/B ratio suggests that the stock may be undervalued, as investors are paying less for the company’s assets than their actual worth. Conversely, a high P/B ratio may indicate that the stock is overvalued, or that investors expect high growth in the company’s future earnings. The P/B ratio is often used by value investors to assess whether a stock is trading at a fair price based on its underlying assets. 

Walmart’s current P/B is very high, standing at 8.85. A P/B that high can be a red flag. It suggests that investors are paying far more than Walmart’s underlying assets are worth in an accounting sense. That could indicate overvaluation. Alternatively, it show a lot of optimism about the stock’s future earnings and cash flow.

Because this valuation is well above the kind of P/B range (e.g., 1–2×) that value investors like Warren Buffett typically favor, it could mean Walmart is less of a classic “bargain value” play today and more a bet on continuing operational strength and competitive positioning.

Return on Investment (ROI)

Illustration 22 and 23: Return on investment (ROI) for Walmart from 2010 to 2025

For value investors, Return on Investment (ROI) is a key metric for evaluating Walmart, as it shows how efficiently the company is using its capital to generate profits. A strong ROI indicates that Walmart is generating solid returns relative to the capital it deploys, making it an attractive investment even if the absolute revenue numbers are large.

Historically, Walmart’s ROI has not been bad, hovering around 23% from 2010 to 2013, reflecting the company’s efficient operations and large-scale retail network. However, the steady decline in ROI from 2010 to 2017 is a concerning sign. This decline is largely driven by rising operating costs. Heavy price reductions were made to remain competitive. Significant investments in e-commerce and supply-chain modernization were also made, which temporarily reduced returns on invested capital.

Encouragingly, recent years have seen ROI increase again, signaling that Walmart’s efficiency improvements, digital initiatives and cost-management strategies are paying off. This rebound is a positive indicator for long-term investors. It shows that Walmart is beginning to generate stronger returns on its investments. The company is continuing to expand and modernize its operations.

Dividend

Illustration 24: Walmart Dividend Yield and dividend payout ratio from 2005 to 2025.

Walmart currently pays an annual dividend of $0.94 per share, giving it a dividend yield of about 0.89%, which is relatively modest for an income investor. Its payout ratio (the portion of earnings distributed as dividends) hovers around 35%, based on trailing 12 months’ earnings.

From a positive perspective, the low payout ratio is a good sign: Walmart retains a large share of its earnings, supporting its growth efforts and e-commerce investment. That makes the dividend relatively sustainable and not likely to be cut under normal circumstances.

However, there are some cautionary points. The very low yield (below 1%) means that Walmart is not especially attractive purely for dividend income. Investors looking for yield might find other options more compelling. In addition, while Walmart has grown its dividend steadily, a low yield suggests that the market is valuing the stock more for growth potential than for current income.

Insider Trading

Illustration 25: Most recent insider trading at Walmart, gathered from Walmart Inc. (WMT) Recent Insider Transactions – Yahoo Finance. Please consult yahoo finance for most updated list.

In recent months, Walmart insiders have sold a significant amount of stock, which can be considered a red flag for investors. The Walton Family Holdings Trust, which owns roughly 10% of the company, sold 7.56 million Walmart shares worth about $740.9 million. CEO Doug McMillon also sold 19,416 shares at prices between $95.97 and $96.09 and Executive Vice President John R. Furner sold 13,125 shares at prices ranging from $106.38 to $109.51. Most of these sales were conducted under prearranged Rule 10b5‑1 trading plans. These plans allow insiders to sell shares according to a pre-approved schedule. The scale of these transactions is notable. This could signal that insiders believe the stock is overvalued.

Rule 10b5‑1 plans reduce the likelihood that trades reflect a sudden loss of confidence. Despite this, the combination of large insider sales and Walmart’s high valuation suggests caution. It may indicate that key executives and major shareholders are taking profits while the stock price is elevated, which can be a warning sign for potential investors. Walmart’s insider trading policy requires trades to occur during open windows. They must also be under pre-approved plans. This provides governance oversight. However, the recent activity still highlights that insiders are reducing their exposure.

Overall, the scale and timing of these insider sales is a red flag, suggesting that Walmart may be trading at a premium and long-term investors should consider this carefully when evaluating the stock.

Other Company Info

Founded in 1962, Walmart Inc. is one of the world’s largest and most recognized retail corporations, known for its extensive store network, low prices and growing e-commerce operations. As of 2024, Walmart employs approximately 2.1 million people globally, reflecting its vast operations in retail, supply chain, logistics and digital commerce. The company is publicly traded on the New York Stock Exchange under the ticker symbol WMT and operates within the Consumer Staples sector, specifically in the Retail—Discount Stores industry.

Walmart is headquartered at 702 S.W. 8th Street, Bentonville, Arkansas, USA. As of 2024, the company has approximately 2.82 billion shares outstanding, with a market capitalization of over $470 billion USD. For more information, visit Walmart’s official website: https://corporate.walmart.com


Illustration 26-28: Number of employees and location of Walmart

Final Verdict

Overall, Walmart is not recommended as a value investment at this time. The stock appears significantly overpriced, with a high P/E ratio, elevated insider selling, and a price well above historical levels. While Walmart remains a financially strong company with solid operations, steady dividends, and improving profitability in recent years, the current valuation limits upside potential for long-term investors. Retail as a sector is also highly competitive

Go back

Your message has been sent

Warning


Amgen Inc. – A Stock Analysis of one of the world’s leading biotech innovators

Amgen Inc. is not just a biotechnology company, it is one of the original pioneers that shaped the biotech industry as we know it today. Founded in 1980 and headquartered in Thousand Oaks, California, Amgen has become a symbol of innovation, transforming cutting-edge science into life-saving therapies that have touched millions of patients around the world.

AMGN Stock Price and Chart — NASDAQ:AMGN — TradingView

Illustration 1: The Amgen logo, symbolising the company’s advancing capabilities in AI and data science.

Unlike traditional pharmaceutical firms that built their dominance on chemistry and small-molecule drugs, Amgen bet early on the future of biologics which is therapies created from living cells.

This daring strategy paid off spectacularly. Amgen helped launch the “biotech revolution” with drugs like Epogen and Neupogen, forever changing the treatment of anemia and cancer care.

Today, Amgen stands as one of the world’s largest independent biotech companies, with a product portfolio spanning oncology, immunology, cardiovascular medicine, bone health and rare diseases. Its bold acquisitions, advanced biologics manufacturing, and unmatched focus on genetics-driven medicine have positioned it at the forefront of the healthcare transformation of the 21st century.

The company’s philosophy is simple but powerful: Unlock the power of biology for patients suffering from serious illnesses. In an age when medicine is converging with genetics, AI, and data-driven discovery, Amgen remains one of the companies that can truly change the trajectory of human health.

Amgen’s story begins in 1980, when a group of scientists and visionaries founded Applied Molecular Genetics (AMGen) in Southern California. At the time, genetic engineering was still a radical, untested field.

Original employee shares stories from Amgen's early days

Illustration 2: Amgen’s first labs in the early 1980s where the biotech revolution began.


Most pharmaceutical giants dismissed it as too speculative. But Amgen’s founders believed that decoding and manipulating DNA could unlock a new era of medicine.

The company’s first great breakthrough came in 1989, when the U.S. FDA approved Epogen (epoetin alfa), the world’s first recombinant human erythropoietin. This drug changed the lives of kidney disease patients by treating anemia and it became one of the fastest-growing biotech drugs in history.

Medicare overspending on anemia drug - The Washington Post

Illustration 3: Amgen’s first breakthrough came through the drug Epogen which treats anemia.

Two years later came Neupogen (filgrastim), a therapy that boosted white blood cells in chemotherapy patients. For the first time, doctors could reduce the devastating immune side effects of cancer treatment. These early breakthroughs cemented Amgen’s reputation as the biotech company that delivers.

Through the 1990s and 2000s, Amgen expanded aggressively, both organically and through acquisitions. The purchase of Immunex in 2002 brought in Enbrel, a blockbuster treatment for autoimmune diseases such as rheumatoid arthritis and psoriasis. By then, Amgen was no longer a scrappy biotech startup, it was a full-fledged global pharmaceutical giant.

In the 2010s, Amgen doubled down on precision medicine and next-generation biology. The acquisition of Onyx Pharmaceuticals in 2013 brought in oncology assets like Kyprolis, while the purchase of deCODE Genetics in Iceland gave Amgen one of the largest and most detailed human genetic databases in the world.

Most recently, in 2023, Amgen made headlines with its $28 billion acquisition of Horizon Therapeutics, significantly expanding its rare disease portfolio. This deal was a statement: Amgen intends to remain a global biotech leader for decades to come.

Today, Amgen has more than 25,000 employees worldwide, operates major facilities in the U.S., Europe, and Asia, and maintains one of the most diverse and innovative pipelines in biotechnology.

Amgen is renowned for its ability to turn cutting-edge science into blockbuster therapies, consistently delivering medicines that transform the standard of care for millions of patients worldwide. Its portfolio covers a wide spectrum of therapeutic areas, making it one of the most diversified players in the biotechnology industry.

  • Oncology

Amgen has long been a leader in oncology, developing therapies that push the boundaries of cancer treatment. The segment, which represents about 12% of revenues, is anchored by a strong lineup of targeted medicines that tackle some of the most challenging cancers.


These include Blincyto, a first-in-class bispecific T-cell engager that directs the immune system to attack leukemia cells; Lumakras, the first successful therapy to target the notoriously “undruggable” KRAS mutation; Kyprolis, which extends survival in multiple myeloma; and Vectibix, a monoclonal antibody that targets colorectal cancer with specific genetic markers. Together, they illustrate Amgen’s ability to transform cutting-edge science into life-saving therapies that change the future of oncology.

  • Immunology

Autoimmune and inflammatory disorders remain one of Amgen’s strongest areas, generating roughly 18% of company revenues.

Immunology | Studium Biologie | UZH

Illustration 4: Immunology remains one of Amgen’s key focus areas accounting for 18% of total revenue.

Key products include Enbrel, a long-standing cornerstone treatment for rheumatoid arthritis and related conditions; Otezla, a convenient oral therapy for psoriasis and psoriatic arthritis; and Tezspire, an advanced biologic for severe asthma developed in partnership with AstraZeneca.

  • Cardiovascular Health

Cardiovascular diseases remain the leading cause of death worldwide, and Amgen plays a vital role in prevention. Roughly 15% of revenues come from this category.

Amgen’s key product is Repatha a PCSK9 inhibitor that slashes LDL cholesterol to unprecedented lows, preventing heart attacks and strokes.

Amgen R.I. is growing its operations to heal the world

Illustration 5: Amgen employees researching drugs.

  • Bone Health

Bone health therapies contribute about 13% of total revenues, largely driven by two highly successful biologics: Prolia which is widely prescribed for osteoporosis, especially among postmenopausal women and Xgeva protecting cancer patients against skeletal complications when tumors spread to bone.

  • Nephrology

Amgen’s history began with kidney disease, and nephrology products still generate around 8% of company revenues.

Epogen remains a cornerstone therapy for anemia associated with chronic kidney disease, while Aranesp, a longer-acting successor, provides enhanced convenience and efficacy. Additionally, Parsabiv addresses secondary hyperparathyroidism in dialysis patients, reinforcing Amgen’s leadership in renal care.

  • Rare Diseases

The 2023 acquisition of Horizon Therapeutics added a high-growth rare disease portfolio, now representing about 12% of Amgen’s revenues.

Key products include Tepezza which is the first treatment for thyroid eye disease and Krystexxa a biologic breakthrough for uncontrolled gout.

About Biosimilars - KabiCare

Illustration 6: Biosimilars is the largest revnue stream of Amgen accounting for around 20%.

  • Biosimilars

Amgen has also built a robust biosimilars business, accounting for roughly 20% of total revenues. Biosimilars are biologic medical products that are highly similar to an existing, approved “reference” biologic medicine, with no clinically meaningful differences in safety, quality, or effectiveness. 

They become available after the patent for the original biologic expires, offering more competition, increased market access, and potentially lower costs for patients and healthcare systems.  Amgen is producing high-quality, lower-cost alternatives to blockbuster biologics like Humira, Avastin, and Herceptin.

What truly sets Amgen apart is its genetics-first approach. Through deCODE Genetics in Iceland, Amgen analyzes genetic data from hundreds of thousands of individuals to identify disease pathways at the molecular level.

Human genes patent ruling: some clarity but real problem remains | Genetics  | The Guardian

Illustration 7: deCode Genetics providing genetic data to Amgen.

This enables Amgen scientists to design drugs that target the root biological causes of disease, not just the symptoms. The company has applied this method to cardiovascular medicine (Repatha), oncology (Lumakras), and even neuroscience.

The crown jewel of this approach is Lumakras (sotorasib), the first therapy to target the infamous KRAS mutation in cancer once considered “undruggable.” This was a watershed moment in oncology, proving that genetic-driven drug discovery can crack the toughest challenges in medicine.


Amgen competes in one of the most competitive industries in the world, facing rivals that include both traditional pharma giants and fast-moving biotech innovators. Under are some of the biggest competitors detailed:

  1. Pharma Giants
  • Roche is a global oncology leader known for blockbuster biologics like Herceptin and compete in the same sector as Amgen.
  • Novartis is a pioneer in gene and cell therapies, including Zolgensma.
  • Pfizer is a multinational powerhouse with a broad biologics and vaccine portfolio.

2. Biotech Rivals

  • Regeneron is strong in monoclonal antibodies and treatments for rare diseases.
  • Gilead Sciences specializes in oncology and antiviral therapies.
  • Biogen focuses on neurodegenerative and neurological disorders.

3. Disrupters & Innovators

  • Moderna & BioNTech are leaders in mRNA technology with rapid-response vaccines and therapies.
  • Vertex Pharmaceuticals is a specialist in cystic fibrosis and precision genetic medicines.
  • CRISPR-focused firms (CRISPR Therapeutics, Intellia) are advancing revolutionary gene-editing therapies.

Amgen’s advantages are as distinct as Toyota’s legendary production system. Its biologics manufacturing scale is unmatched, few companies can produce complex cell-derived medicines at Amgen’s level of quality and consistency.

Investors are Disappointed in Early Findings of Amgen's O... - Newsweek

Illustration 8: Amgen’s products placed in a pharmacy

Its genetics-driven R&D provides a cutting-edge edge over traditional pharma. By integrating deCODE Genetics, Amgen doesn’t just test hypotheses it designs them from the genetic blueprint of human disease.

Add to this its balanced portfolio (innovator biologics + biosimilars + acquisitions) and you have a company with both stability and upside. By combining innovator biologics, high-quality biosimilars, and strategic acquisitions such as Horizon Therapeutics, the company achieves a blend of stability and growth potential.

This diversified strategy reduces dependency on any single product or therapeutic area while creating multiple revenue streams that can fuel future innovation.


Perhaps most importantly, Amgen has demonstrated a capacity for bold adaptation. The company continues to expand into new therapeutic frontiers, including RNA therapies, cell and gene therapy, and precision medicine, positioning itself for the next generation of biotech breakthroughs.

Its forward-looking approach, combined with operational excellence and a strong pipeline, makes Amgen a resilient leader capable of sustaining growth and innovation in an intensely competitive industry.

Amgen is at a pivotal moment in biotech history. The company is leading in oncology (Lumakras), expanding in rare diseases (Horizon), and pushing into new frontiers like cell therapy, gene editing, and RNA-based medicine.

It aims to build therapies that don’t just treat disease but potentially cure it, a shift that could redefine healthcare economics worldwide.Its biosimilar pipeline ensures continued global presence, particularly in emerging markets, while its genetics-first innovation model promises a steady stream of breakthroughs.

Amgen Drug Substance Manufacturing Plant, Wake County, North Carolina

Illustration 9: Amgen is well equipped for the future

As the biotech race accelerates from mRNA to CRISPR to gene therapies, Amgen has the resources, scale, and scientific firepower to remain a central player in the future of medicine.

In short: Amgen is not just a biotech stock, it’s a bet on the future of healthcare itself.


Stock Analysis

In this section we will analyze Amgen’s stock to see if it is a good stock to buy or not. Our philosophy is value investing meaning that we try to find good quality companies that are undervalued. However, we will give a holistic overview so all kind of investors with different philosophies can judge the stock for themselves.

Revenues and Profits

Illustration 10 and 11:  Revenue of Amgen from 2009 to 2024

Amgen has demonstrated steady and consistent revenue growth over the years, reflecting disciplined operations and strategic investments. From approximately $14.6 billion in 2009 to an estimated $35.4 billion in 2025 which is a green flag as it has maintained a smooth upward trajectory.

This consistent growth underscores Amgen’s resilience and strategic foresight. The company’s balanced portfolio, encompassing innovator biologics, biosimilars, and acquisitions, has contributed to its stability and upside potential. Moreover, Amgen’s adaptability is evident in its expansion into new therapeutic areas, investments in RNA therapies, and positioning for the age of cell and gene therapy. These factors collectively make Amgen a compelling choice for value investors seeking stability and growth.

However, Amgen has had a reduction in its revenue growth such as from 2016 to 2017 or from 2018 to 2019 mainly due to the very high competition in the healthcare sector. These developments should always be closely watched by a potential investor.

Illustration 12 and 13: Net Income of Amgen from 2009 to 2024

Net income is a crucial metric to evaluate when determining whether a company is a worthwhile investment. It represents a company’s net profit or loss after accounting for all revenues, income items, and expenses, calculated as Net Income = Revenue – Expenses.

Amgen’s revenue trajectory has exhibited notable volatility, with significant declines observed in 2017 and 2024, signaling potential concerns for investors. While Amgen’s diversified portfolio and strategic acquisitions have positioned it for long-term growth, the observed volatility in net income raises concerns about its financial stability. Investors should carefully consider these factors when evaluating Amgen’s investment potential. The decline in 2024 was due to its obesity drug test results failing to meet expectations while its general volatility is due to the higly competitive pharma market leading to lower drug prices.

Revenue Breakdown

Illustration 14: Amgen Revenue breakdown gathered from gurufocus.

As shown in Illustration 12, Amgen’s core biologics and innovative therapies remain its largest revenue driver, consistently contributing roughly 65–70% of total revenue. This includes sales of blockbuster products such as Enbrel, Repatha, Prolia, and Neulasta across global markets. Amgen’s diverse portfolio spans oncology, cardiovascular, bone health, and nephrology, providing broad therapeutic coverage and strong patient demand. Its leadership in monoclonal antibodies and targeted therapies has been a key factor in sustaining recurring revenues from both established and new products.

In addition to innovator biologics, Amgen’s biosimilars business contributes around 20% of total revenue, offering lower-cost alternatives to widely prescribed biologics like Humira, Avastin, and Herceptin. This segment supports Amgen’s growth by expanding patient access and diversifying revenue streams, particularly in regions with pricing pressure on branded drugs.

Amgen also generates revenue from recent acquisitions, including Horizon Therapeutics, which accounts for roughly 10–12% of total revenue. Horizon’s rare disease therapies, such as Tepezza and Krystexxa, have become significant growth drivers and complement Amgen’s existing portfolio by targeting high-value, specialty markets.

Emerging technologies, including RNA therapies, gene therapy programs, and cell therapy initiatives, currently contribute a smaller portion of revenue, estimated at 2–3%, but are central to Amgen’s long-term innovation strategy. Heavy investment in R&D approximately 21% of revenue underpins the development of next-generation biologics and precision medicine, ensuring future competitiveness.

Overall, Amgen’s revenue structure reflects both stability and forward-looking diversification. Its core biologics provide predictable cash flow, biosimilars and acquisitions drive growth and resilience, and emerging therapeutic technologies position the company for leadership in an evolving biotech landscape.

Earnings per Share

Illustration 15:  Earnings per share for Amgen from 2009 to 2024

Earnings Per Share (EPS) is a key financial metric that measures a company’s profitability on a per-share basis. It indicates how much profit a company generates for each outstanding share of its stock, and is used to assess a company’s financial health, profitability, and potential for growth. In other words this metric can tell us how profitable the business is.

Amgen’s earnings per share (EPS) from 2009 to 2024 has shown significant volatility, rising and falling in response to competitive pressures and strategic investments. While EPS grew from around $4.51 in 2009 to an estimated $12.49 in 2023, the journey was uneven, with sharp declines in 2017 due to biosimilar competition impacting Enbrel, Neulasta, and Epogen, and again in 2024, when higher operating expenses, acquisition-related costs from Horizon Therapeutics, and mark-to-market losses weighed on profitability.

This volatility underscores that, while Amgen has strong long-term growth potential driven by its innovative biologics, biosimilars, and emerging therapies in RNA and gene editing, it also presents a potential red flag for investors. The swings in EPS reflect sensitivity to competitive dynamics, pricing pressures, and strategic investment decisions, emphasizing the importance of careful evaluation for those seeking stable returns in the biotech sector.

Assets and Liabilities

Illustration 16 and 17: Assets and Liabilities for Toyota from 2009 to 2024

When evaluating a company as a potential investment, understanding its assets and liabilities is crucial. If a local business owner offered to sell their shop to you, one of the first questions. after determining its profitability, would be about its equity and assets. The same principle applies when assessing publicly traded companies like Amgen.

As shown in Illustrations 16 and 17, Amgen’s cash on hand has fluctuated significantly between 2009 and 2024. While it stood at approximately 13.4 in 2009, it declined to around 11.9 in 2024. This volatility is concerning for investors, as stable or growing cash reserves are generally seen as a sign of financial resilience. Moreover, unlike many of its industry peers that have steadily built stronger liquidity positions over time, Amgen has not demonstrated the same upward trajectory, raising questions about its ability to generate and retain cash.

What is particularly troubling is that Amgen’s cash on hand remains well below its long-term debt obligations. This imbalance suggests that the company may face challenges in meeting debt repayments without relying heavily on external financing or sacrificing future growth opportunities. For potential investors, this combination of fluctuating liquidity, lack of upward trend, and high leverage signals a weaker financial cushion, an important risk factor to consider before making an investment decision.

Amgen’s total assets have increased steadily from USD 36.9 billion in 2009 to USD 91.8 billion in 2024, a positive indicator for potential investors as it reflects consistent expansion and resource growth. However, this comes with a caveat: the company’s total liabilities have also risen sharply, climbing from USD 16.9 billion in 2009 to USD 85.9 billion in 2024. Such a steep increase signals a growing reliance on debt financing, which can limit financial flexibility and elevate risk.

This trend has had a clear impact on shareholder equity, which has declined significantly over the period. For investors, this is a red flag, as shrinking equity reduces the financial cushion that protects shareholders in times of stress. Notably, the sharp drop in equity between 2016 and 2017 was largely driven by aggressive share buybacks combined with increased debt, which eroded the company’s balance sheet strength.

In summary, while Amgen’s asset growth highlights its ability to expand operations and generate value, the simultaneous surge in liabilities and erosion of equity paint a more cautious picture. For potential investors, this combination raises concerns about long-term sustainability, leverage management, and the balance between rewarding shareholders in the short term versus safeguarding financial stability for the future.

Debt to Equity Ratio

Illustration 18 and 19: Debt to Equity ratio for Amgen from 2009 to 2024

The Debt-to-Equity (D/E) ratio is an important financial metric for assessing a company’s financial leverage and risk. It compares the amount of debt the company uses to finance its operations relative to its shareholder equity. A high D/E ratio suggests that the company relies more heavily on debt to fuel growth, which could increase financial risk, especially during economic downturns when managing debt obligations becomes more challenging. In contrast, a lower D/E ratio indicates that the company is primarily financed through equity, reducing financial risk but potentially limiting its ability to rapidly expand.

Legendary value investor Warren Buffett generally prefers a debt-to-equity (D/E) ratio below 0.5. In stark contrast, Amgen’s D/E ratio stood at an alarming 10.83 in 2024, underscoring its heavy dependence on debt financing. Even more concerning, Amgen’s D/E ratio has been on an upward trajectory from 2009 through 2025, reinforcing the picture of mounting leverage and growing financial risk.

The ratio spiked sharply between 2021 and 2022, a period likely linked to heightened borrowing or shareholder distributions, before experiencing a notable decline from 2022 to 2023 as equity levels temporarily stabilized or debt levels adjusted. Nevertheless, the overall trend remains troubling: Amgen’s capital structure is overwhelmingly debt-driven, which raises red flags for investors seeking long-term stability.

Price to earnings ratio (P/E)

Illustration 20 and 21: PE ratio for Amgen from 2010 to 2025

For value investors, one of the most critical metrics when evaluating Amgen’s stock is the price-to-earnings (P/E) ratio, as it helps assess whether the company is undervalued or overvalued. Even if a company has strong financials, purchasing its stock at a high price can lead to poor returns. For example, imagine a business generating solid profits of $1 million per year. If the owner offers to sell you the business for just $1, it would be an incredible deal. But if the owner asks for $1 trillion, even though the business is profitable, the price would be absurdly overvalued. The stock market works similarly, companies can be priced cheaply on some days and excessively expensive on others.

Warren Buffett, a legendary value investor, typically considers stocks with a P/E ratio of 15 or lower as “bargains.” A high P/E ratio suggests that investors are paying a premium for the company’s earnings, expecting significant growth. In 2010, Amgen’s P/E ratio stood at around 8.72, aligning with Buffett’s preferred range. However, in subsequent years, the ratio trended upward, reflecting growing investor confidence in its earnings potential. This relatively elevated valuation suggests that investors are pricing in continued earnings stability and growth from Amgen’s biotechnology portfolio, but it also signals that the stock is not necessarily trading at a deep discount. For value-oriented investors, Amgen’s current P/E ratio may appear less attractive compared to traditional “bargain” opportunities. However, for growth-leaning investors, the premium could be justified if Amgen continues to deliver strong R&D output, sustain its drug pipeline, and expand into new therapeutic areas.

Price to Book ratio (P/B)

Illustration 22 and 23: PB ratio for Amgen from 2010 to 2025

Price-to-book value (P/B ratio) is a financial metric used to compare a company’s market value (its stock price) to its book value (the net asset value of the company, calculated as total assets minus total liabilities). The P/B ratio is calculated by dividing the current share price by the book value per share. A lower P/B ratio suggests that the stock may be undervalued, as investors are paying less for the company’s assets than their actual worth. Conversely, a high P/B ratiomay indicate that the stock is overvalued, or that investors expect high growth in the company’s future earnings. The P/B ratio is often used by value investors to assess whether a stock is trading at a fair price based on its underlying assets. Legendary Investor Warren Buffet prefers company’s with P/B lower than 1.5 and often buys around 1.3 or lower.

The price-to-book (P/B) ratio of Amgen has consistently traded at a relatively high P/B ratio, reflecting strong investor confidence in its future earnings power. In 2010, Amgen’s P/B ratio stood at around 1.78, already slightly above Warren Buffett’s preferred range of 1.3–1.5. Over the following years, it climbed further, reaching approximately 3.05 in 2015, before peaking at 126.17 in 2022. Even after moderating slightly, Amgen’s P/B remained elevated at 19.79 in 2024, far above levels considered attractive by traditional value investors.

This persistently high P/B ratio suggests that the market values Amgen primarily for its intellectual property, drug pipeline, and R&D potential rather than its tangible asset base. For conservative, asset-focused investors, such a valuation may be a red flag, signaling that the stock could be overvalued relative to book value. However, for growth-oriented investors, the premium reflects confidence in Amgen’s ability to sustain innovation, generate high margins, and capitalize on its biotechnology expertise. In short, Amgen’s P/B ratio does not signal a “hidden bargain” in the Buffett sense, but rather a market willing to pay a steep premium for its intangible strengths and future earnings potential.

Return on Investment (ROI)

Illustration 24 and 25: ROI for Amgen from 2010 to 2024

For value investors, another essential metric when evaluating Amgen stock is Return on Investment (ROI), as it reveals how efficiently the company is using its capital to generate profits. In simple terms, ROI measures how much return a business earns relative to the capital invested to run it. Even if a company shows strong revenues, if it needs massive amounts of capital to produce modest profits, it may not be an attractive investment. For example, if one company generates a $100,000 return on a $1 million investment, while another earns the same return on just $500,000, the latter is clearly more efficient and potentially more valuable. ROI helps investors identify these distinctions and avoid companies that consume capital without delivering proportional returns. The higher the ROI, the better but it is also very industry dependent as some industries need a lot more capital than others. Legendary investor Warren Buffett has often stated that he seeks returns of at least 15% annually on his investments over time. While he doesn’t quote ROI specifically, this is effectively what he aims for in terms of return on invested capital and intrinsic value growth.

Amgen has historically delivered a relatively strong Return on Investment (ROI), reflecting the capital-light nature of the biotechnology sector compared to asset-heavy industries like automotive. In 2010, Amgen’s ROI stood at approximately 21.63%, already well above the averages seen in more capital-intensive businesses. Over the following years, ROI fluctuated but generally trended upward, reaching 15.08% in 2016 and peaking at around 24.92% in 2020, comfortably within the range Warren Buffett often cites as desirable for long-term investments. However, this efficiency has not been fully consistent, Amgen’s ROI fell to 10.42% in 2024, before recovering modestly to 13.2% in 2025.

These shifts highlight both the strength and the vulnerability of Amgen’s business model. On one hand, the company demonstrates the ability to generate high returns on invested capital when its drug pipeline performs strongly, underscoring its competitive advantage in biotechnology. On the other hand, the recent decline signals the risks tied to patent expirations, R&D costs, and the volatility of drug approvals. For investors, Amgen’s ROI profile is a mixed but still compelling signal: while not always meeting Buffett’s ideal threshold, it frequently approaches or exceeds it, showing that the company has the potential to deliver strong long-term value when it manages its capital efficiently.

Dividend

Illustration 26: Dividend yield and dividend payout ratio for Amgen from 2014 to 2024.

Amgen has built a reputation as a consistent dividend payer in the biotechnology sector, a rarity in an industry where many peers reinvest heavily without returning capital to shareholders. In 2009, Amgen paid an annual dividend of USD 0.56 per share, but since then, its payouts have grown substantially, reaching USD 8.53 per share in 2024. This reflects a remarkable compound annual growth rate in dividends, underscoring the company’s strong cash generation capacity and long-term commitment to shareholder returns. At the 2024 level, Amgen’s dividend yield stood at around 3.2%, comfortably above the average for the broader pharmaceutical and biotech sector, which typically ranges between 1.5% and 2.5%.

This steady and growing dividend stream highlights Amgen’s maturity as a company and its ability to balance rewarding shareholders with funding an active R&D pipeline. However, there are risks: Amgen’s high debt levels and declining equity base (as discussed earlier) could constrain its ability to sustain aggressive dividend growth in the long run. Moreover, as its drug portfolio faces patent expirations, the company will need to rely on pipeline success and acquisitions to protect earnings and, by extension, dividend stability.

Overall, Amgen’s dividend history is a green flag for income-seeking investors, as it provides reliable and above-average yields in an industry where dividends are not always guaranteed. That said, the company’s elevated leverage and future capital needs pose risks that cannot be ignored. For conservative, long-term investors, the dividends are attractive, but they should be weighed against the balance sheet pressures and reliance on future drug pipeline performance.

Insider Trading

Over the past year, insider trading activity at Amgen has been dominated by sales rather than purchases, with several senior executives reducing their holdings. For instance, Jonathan P. Graham, Amgen’s Executive Vice President and General Counsel, sold about 25,045 shares worth roughly $7.3 million. David M. Reese, Executive Vice President and Chief Technology Officer, executed multiple sales, including a transaction of 25,225 shares valued at around $7.7 million, as well as an additional sale of 8,711 shares. Murdo Gordon, Executive Vice President of Global Commercial Operations, sold approximately 8,771 shares for $2.6 million, while Nancy A. Grygiel, Senior Vice President and Chief Compliance Officer, sold about 1,589 shares for nearly $484,000. More recently, Senior Vice President Rachna Khosla sold 1,500 shares valued at $434,000.

In total, insider sales over the past twelve months are estimated at around $12 million, with no notable insider purchases reported during the same period. Insider ownership at Amgen remains very small, less than 1% of total outstanding shares, indicating that management’s direct equity exposure to the company’s stock performance is limited.

From an investor’s perspective, this trend leans toward a red flag. While insider selling does not always signal a lack of confidence. executives often sell shares to diversify portfolios or cover tax obligations, the absence of insider buying is noteworthy. If insiders viewed Amgen’s stock as undervalued, one would expect at least some buying activity. The consistent pattern of large, multi-million-dollar sales by multiple executives suggests that insiders believe the stock is fairly valued or that near-term upside may be limited.

That said, these sales should be interpreted in context. Amgen remains a financially strong biotechnology company with a robust drug pipeline and solid cash generation, and there is no indication of distress or panic selling. For long-term investors, insider selling may not necessarily undermine the company’s fundamentals, but the lack of buying activity is a cautionary sign that should not be ignored.

Other Company Info

Founded in 1980, Amgen Inc. is a leading American multinational biopharmaceutical company headquartered in Thousand Oaks, California. As of 2024, the company employs approximately 28,000 people globally, reflecting its extensive operations in biotechnology research, development, manufacturing, and commercialization of human therapeutics. Amgen is publicly traded on the NASDAQ under the ticker symbol AMGN and operates within the Healthcare sector, specifically in the Biotechnology industry.

Amgen Inc.’s corporate headquarters is located at One Amgen Center Drive, Thousand Oaks, CA 91320-1799, United States. As of September 19, 2025, Amgen’s market capitalization is approximately $153.65 billion USD. The company maintains a diverse portfolio of roughly 40 products across four therapeutic areas: General Medicine, Rare Disease, Inflammation, and Oncology. For more information, visit Amgen’s official website: https://www.amgen.com.

Illustration 27-29: Location and number of employees of Amgen.

Final Verdict

Amgen Inc. presents a mixed picture for long-term investors. On the positive side, the company has a strong track record of revenue growth, robust free cash flow, and a history of steadily increasing dividends, making it attractive for income-focused investors. Its diverse product portfolio across General Medicine, Rare Disease, Inflammation, and Oncology provides stability and resilience in a volatile biotechnology market.

However, Amgen’s heavy debt load is a significant concern. With long-term liabilities far exceeding cash on hand and a high debt-to-equity ratio, the company’s financial leverage raises questions about its ability to navigate downturns or unexpected challenges without compromising growth or dividends. This elevated debt adds a layer of risk that cannot be ignored, especially for investors seeking safer, lower-risk investments. Furthermore, the price ratioes suggest that it is not undervalued and is as such not a good choose for value investors.

While Amgen’s strong pipeline and consistent cash generation offer upside, its high leverage makes it a riskier bet compared to peers with more conservative balance sheets. Long-term investors should weigh the potential rewards against the substantial financial risk posed by its indebtedness.

The Indian Economy: A sleeping Giant

India is more than just a country, it is a civilization that spans thousands of years, a vibrant continent in its own right, and an economic marvel constantly in motion. With a history that stretches back over five millennia, India remains one of the world’s oldest cultures while simultaneously being one of the youngest and fastest-growing economies on the planet.

Fil:Flag of India.svg – Wikipedia

Today, it stands as the most populous nation on Earth, the fifth-largest economy by nominal GDP, and a powerhouse of innovation and entrepreneurship. The economy of India is a developing mixed economy with a notable public sector in strategic sectors.

Known as the world’s largest democracy, India is a federal republic composed of 28 states and 8 union territories. It is a nuclear-armed nation, a member of influential groups such as the G20, BRICS, and the World Trade Organization, and holds a pivotal position in the Indo-Pacific region both strategically and economically.

As of 2024, India’s nominal GDP reached nearly $3.9 trillion, edging past the United Kingdom and approaching the size of Germany’s economy. When measured in purchasing power parity terms, India ranks third globally behind China and the United States. This remarkable economic ascent is fueled by a young and expanding population of 1.44 billion people, a rapidly growing middle class, and a labor force increasingly skilled in technology and services.

his article explores the complex and fascinating story of India’s economic evolution, from its early days of immense wealth through the hardships of colonialism, the challenges of socialist policies, and finally the remarkable liberalization that catapulted the nation into the global spotlight. Whether you are an investor, student, or simply curious about global affairs, India’s economic journey offers profound lessons in resilience, ambition, and transformation.

India’s history as an economic power dates back thousands of years, when it accounted for roughly a quarter to a third of the world’s GDP. During ancient times, great empires such as the Mauryas, Guptas, Cholas, and later the Mughals presided over prosperous kingdoms that exported textiles, spices, gems, and rich cultural knowledge to distant lands. India’s early economy was sophisticated and globally connected, making it one of the wealthiest regions on Earth.


India’s history as an economic power dates back thousands of years, when it accounted for roughly a quarter to a third of the world’s GDP. During ancient times, great empires such as the Mauryas, Guptas, Cholas, and later the Mughals presided over prosperous kingdoms that exported textiles, spices, gems, and rich cultural knowledge to distant lands. India’s early economy was sophisticated and globally connected, making it one of the wealthiest regions on Earth.

Art of Legend India: Art, Paintings, Handicrafts, Jewelry, Beads, Handmade  Items: Mughal School of Arts - Mixture Style of Indian and Persian Art

Illustration 2: Mughal Empire of India

However, the arrival of European colonial powers, especially the British East India Company in the 18th century, marked a profound shift. What was once a manufacturing and trading powerhouse became a supplier of raw materials and a captive market for British goods.

The colonial period saw the systematic deindustrialization of India’s traditional industries, such as the famous textile mills of Bengal, and the extraction of wealth that hindered economic progress for nearly two centuries. By the time India gained independence in 1947, its share of the global economy had dwindled to a mere 3%, a shadow of its former glory.

Life Size Portrait Painting Of Indian Raja Or Emperor

Illustration 3: British India led to India falling from making up 22.6% of the world economy in 1700 to 3.8% in 1952.

After independence, India embarked on a path shaped by the vision of Prime Minister Jawaharlal Nehru, who championed a socialist-inspired model of economic development. The state took control of key industries such as heavy manufacturing, banking, railways, and energy.

While this helped establish a basic industrial base, it also resulted in the notorious “License Raj,” a cumbersome system of permits and bureaucratic controls that stifled entrepreneurship and economic dynamism. For decades, India’s growth rate lingered at a modest 3 to 4 percent, a pace so slow it was mockingly dubbed the “Hindu rate of growth.

The turning point came in 1991 when a severe balance of payments crisis forced India to fundamentally rethink its economic model. Led by Finance Minister Manmohan Singh, the government embarked on sweeping reforms that dismantled import restrictions, reduced subsidies, and opened the economy to foreign investment. This liberalization unleashed a wave of economic activity that transformed India into a global player. The IT sector boomed, telecom networks expanded, pharmaceutical companies grew to global prominence, and financial markets developed rapidly. India’s economy accelerated, foreign reserves surged, and the nation gained credibility on the world stage.


India’s economy is broadly divided into three main sectors: agriculture, industry, and services. Together, these sectors weave a complex and sometimes contradictory tapestry. While agriculture still employs the largest share of the workforce, roughly 43% of the population, it accounts for only about 20% of GDP.

Twin Size Star Mandala Tapestry Cute Indian Wall Hanging Twin Bedding

Illustration 4: The Indian economy is complex like a tapestry

Industry contributes around a quarter of the GDP and employs about a quarter of the labor force. The services sector dominates the economy, representing more than half of the country’s GDP, yet employs only about a third of the workers. This structural imbalance highlights some of India’s greatest development challenges but also points to immense opportunities for growth and modernization.’

Historically a late bloomer in manufacturing, India has increasingly turned its attention to industrial development. The government’s flagship initiative, “Make in India,” aims to expand the manufacturing sector’s share of GDP to 25 percent.

he automobile sector is one of the largest in the world, with companies like Tata Motors, Mahindra & Mahindra, bajaj auto, TVS motor company, Atul Auto and Maruti Suzuki producing millions of vehicles annually. As of 2023, India ranked as the fourth-largest automobile producer in the world, following China, United States and Japan. T

he sector accounts for approximately 7.1% of India’s GDP and employs over 37 million people directly and indirectly. As of April 2022, India’s auto industry is worth more than US$100 billion and accounts for 8% of the country’s total exports and 7.1% of India’s GDP.

Delhi Sightseeing by Tuk Tuk 2025 - New Delhi

Illustration 5: India is one of the world’s largest producers of tuk tuks

The pharmaceutical industry, often called the “pharmacy of the world,” manufactures 60 percent of the world’s vaccines and is a global leader in generic drugs. Heavy industries such as steel, cement, and chemicals are dominated by conglomerates like Tata Steel and Aditya Birla Group.

India is also carving a niche in emerging industries such as semiconductors, solar energy equipment, and electric vehicles, with states like Gujarat and Tamil Nadu competing fiercely to attract large factories and investment. Defense manufacturing is another growing priority, as India seeks to reduce its dependence on arms imports and develop indigenous capabilities.

Mining contributed to 1.75% of GDP and employed directly or indirectly 11 million people in 2021. India’s mining industry was the fourth-largest producer of minerals in the world by volume, and eighth-largest producer by value in 2009.


In output-value basis, India was one of the five largest producers of mica, chromite, coal, lignite, iron ore, bauxite, barite, zinc and manganese; while being one of the ten largest global producers of many other minerals.

rajasthan tourism decorative collage with traditional culture 40519472  Vector Art at Vecteezy

Illustration 6: Rajesthan is one of the indian states with the most natural resources

Indian cement industry is the 2nd largest cement producing country in the world, next only to China. At present, the Installed Capacity of Cement in India is 500 MTPA with production of 298 million tonnes per annum. Majority of the cement plants installed capacity (about 35%) is located in the states of south India. 

India surpassed Japan as the second largest steel producer in January 2019.The country’s steel sector benefits from abundant iron ore reserves, a large labor force, and strong government support through initiatives like Make in India” and the National Steel Policy. As demand for steel rises both domestically and globally, India continues to expand its production capacity and export footprint.

Petroleum products and chemicals are a major contributor to India’s industrial GDP, and together they contribute over 34% of its export earnings. India hosts many oil refinery and petrochemical operations developed with help of Soviet technology such as Barauni Refinery and Gujarat Refinery, it also includes the world’s largest refinery complex in Jamnagar that processes 1.24 million barrels of crude per day.

By volume, the Indian chemical industry was the third-largest producer in Asia, and contributed 5% of the country’s GDP. India is one of the five-largest producers of agrochemicals, polymers and plastics, dyes and various organic and inorganic chemicals. Despite being a large producer and exporter, India is a net importer of chemicals due to domestic demands. India’s chemical industry is extremely diversified and estimated at $178 billion.

India is one of the largest producers and consumers of chemicals and fertilizers in the world, with the chemical industry contributing over 7% to the country’s GDP and ranking 6th globally in chemical production. At present, 57 large fertilizer units are manufacturing a wide number of nitrogen fertilizers. These include 29 urea-producing units and 9 ammonia sulfate-producing units as a by-product. Besides, there are 64 small-scale producing units of single super phosphate.

The fertilizer sector, vital for India’s agriculture, produced around 43.7 million tonnes of fertilizers in 2024–25, including urea, DAP, and complex fertilizers, supported by government subsidies and increasing adoption of nutrient-based fertilizers. The growing demand from agriculture, textiles, and pharmaceuticals continues to drive expansion in both sectors.

Colorful Dyes At Indian Market by Photo By Meredith Narrowe

Illustration 7: India is one of the largest producers of dye in the world.


Furthermore, when it comes to transportation India is the third-largest domestic aviation market in the world, with passenger traffic reaching over 280 million in 2023. As of 2024, the country has 149 operational airports, up from 74 in 2014, and the government plans to expand this to 220 airports by 2030 under a 1 trillion Indian rupees infrastructure push.

India’s railways, contributing about 2% to the country’s GDP, transport over 8 billion passengers and 1.2 billion tonnes of freight annually, making it one of the world’s largest and busiest rail networks. The sector supports around 7 million jobs, both directly and indirectly, playing a crucial role in driving economic growth and connecting markets across the nation. With ongoing investments in modernization, electrification, and high-speed rail, Indian Railways is set to boost productivity and sustainability even further.

This London Landmark Inspired A Stunning Train Station In Mumbai

Illustration 8: Mumbai train station

India also has multiple ship building companies such as Cochin Shipyard, Hindustan Shipyard and Swan Defence and Heavy Industries, mainly produces ships for European, South American and African shipping companies. Cochin shipyard is the pioneer in autonomous electric propulsion ships.

Agriculture remains the cornerstone of India’s socio-economic landscape, deeply intertwined with the lives of over 40% of the population who depend on it for their livelihoods. Despite its declining share of around 16-17% in the country’s GDP, the sector is critical for ensuring food security, sustaining rural communities, and maintaining social stability across vast regions.

India proudly holds the title as the world’s largest producer of milk, pulses, and spices, and is among the top global producers of staples like rice, wheat, sugarcane, cotton, and a wide variety of fruits and vegetables, feeding over 1.4 billion people.

Yet, beneath this agricultural abundance lies a paradox: low productivity and fragmented landholdings often limit farmers’ incomes and economic resilience. Most farms are small, averaging less than 2 hectares, which constrains the adoption of advanced technology and efficient farming practices.

Additionally, frequent climate shocks, such as droughts, floods, and erratic monsoons, leave millions vulnerable and threaten crop yields year after year. Infrastructure challenges, including inadequate irrigation, poor storage facilities, and inefficient supply chains, further reduce farmers’ ability to maximize profits and reach larger markets.


The glorious history of India's passion for tea, in eight images

Illustration 9: India is one of the largest producers of tea

Recognizing these challenges, India has embarked on a path to modernize agriculture by investing in better irrigation systems, promoting mechanization, improving rural roads and cold storage, and embracing digital technologies like satellite imaging and mobile apps to provide real-time information to farmers.

India’s agriculture and allied sectors remain a vital part of the economy, accounting for 18.4% of GDP and employing nearly 46% of the workforce, despite the sector’s shrinking share in overall economic output, from 52% in 1951 to around 15% in 2023.

The country boasts the largest arable land area in the world, ranking as a top global producer of milk, pulses, spices, rice, wheat, sugarcane, cotton, fruits, and vegetables. However, productivity challenges persist, with yields often only 30% to 50% of global best practices due to small landholdings, inadequate irrigation (only about 39% of cultivated land is irrigated), and infrastructure gaps in storage, roads, and markets. These issues limit farmers’ incomes and keep agricultural output below its full potential.

India is also a global leader in fisheries and aquaculture, ranking 3rd and 2nd respectively, providing livelihoods to millions, and exporting significant quantities of processed products like cashew kernels and milk. While the country produces roughly 316 million tonnes of foodgrains annually, stagnation in output and large post-harvest losses, up to one-third of production, highlight inefficiencies.

Government initiatives like the ₹1.2 trillion Accelerated Irrigation Benefit Programme aim to improve irrigation and infrastructure, but regulatory hurdles and market constraints continue to slow progress. Overall, India’s agriculture sector is a complex blend of immense scale, rich diversity, and urgent need for modernization to boost productivity and farmer prosperity.

Women pounding rice, India stock image | Look and Learn

Illustration 10: Indian women pounding rice, India is one of the world’s largest rice producers

However, progress has been uneven and often slowed by political sensitivities and social complexities. The massive farmer protests of 2020–21 underscored the deep-rooted concerns and emotional ties surrounding land rights, pricing, and market reforms. These protests highlighted how any attempt to transform India’s agricultural sector must carefully balance economic modernization with the protection of farmers’ livelihoods and rights.


Looking ahead, the future of Indian agriculture depends on successfully navigating this delicate balance, integrating technology and innovation while ensuring inclusivity and sustainability. With targeted reforms, climate-resilient farming practices, and strengthened rural infrastructure, India has the potential not only to feed its vast population but also to emerge as a global leader in sustainable agriculture.

The services sector has emerged as the undisputed engine of India’s economic growth, contributing a staggering over 50% of the country’s GDP, making it the largest sector in the Indian economy. From IT and software exports to financial services, healthcare, education, telecommunications, tourism, logistics, and more. the breadth and dynamism of this sector reflect India’s transition from a primarily agrarian economy to a global services leader.

At The Char Minar In Hyderabad by Print Collector

Illustration 11: The city of Hyderabad is becoming a global hub for IT.

Cities like Bengaluru, Hyderabad, Gurugram, and Pune have become world-renowned hubs for IT, software development, business process outsourcing (BPO), and innovation, attracting investments from global tech giants and startups alike.

India’s Information Technology and Business Process Management (IT-BPM) sector alone generated over $250 billion in revenue in 2023, employing more than 5 million professionals, and contributing significantly to foreign exchange earnings.

Indian IT firms serve clients across the globe, from Silicon Valley startups to Fortune 500 corporations, delivering everything from cloud computing to AI solutions. Beyond tech, India’s financial services sector, anchored by robust public and private banks, insurance companies, fintech startups, and stock exchanges like NSE and BSE, plays a pivotal role in capital formation and investor confidence.

India’s telecom sector is a global giant, now the second-largest market in the world with over 1 billion phone subscribers and one of the lowest call tariffs due to intense competition. In FY 2024, telecom equipment production crossed ₹45,000 crore, with exports hitting ₹10,500 crore, driven by the booming smartphone manufacturing industry. India also ranks among the top three globally in internet users, and is the largest DTH television market by subscribers making digital connectivity a key pillar of its economic growth.

Equally significant is the rise of tourism, healthcare, education, retail, e-commerce, and digital services, all of which are rapidly expanding with the growing urban middle class and increasing internet penetration. The Unified Payments Interface (UPI) revolutionized digital transactions, processing billions of transactions monthly, and helped formalize vast segments of the economy. Meanwhile, the services sector has also become a major employment generator, especially in urban and semi-urban areas, offering opportunities in both high-skilled and low-skilled segments.

The government’s focus on initiatives like Digital India, Skill India, and Start-Up India further accelerates the services sector’s potential, promoting entrepreneurship, digital infrastructure, and employment. However, to sustain this momentum, India must address key challenges, such as improving ease of doing business, upskilling the workforce, enhancing service exports, and bridging the digital divide in rural areas.


In essence, the services sector is not just a component of India’s economy, it is its beating heart, transforming the country into a knowledge-based, innovation-driven powerhouse that is well on its way to becoming a major player in the global economic landscape.

India’s 63 million MSMEs (Micro, Small, and Medium Enterprises) contribute 35% to GDP, employ over 111 million people, and make up 40% of exports, earning their title as the “growth engines” of the economy. Though 90% are micro-enterprises with limited scale, 2023 saw a record 179 SME IPOs, showing rising investor interest. With continued policy support and reforms, MSMEs hold the key to tackling unemployment and driving inclusive growth.

India’s digital transformation has been nothing short of revolutionary. Central to this has been the Unified Payments Interface (UPI), a real-time digital payment system that processes billions of transactions monthly, outpacing even the combined digital payments of the US, China, and the EU. The Aadhaar biometric identification system has provided over 1.3 billion Indians with a unique digital identity, enabling unprecedented access to banking, government services, and welfare programs.

Together with the Jan Dhan-Aadhaar-Mobile (JAM) trinity, these innovations have democratized access to finance and services across vast rural and urban populations. The government’s Digital India initiative aims to further embed technology into governance, business, and daily life, while targeted programs such as Startup India and the Semiconductor Mission are propelling innovation and domestic manufacturing.

Furthermore, India’s youthful population is one of its greatest assets. With a median age of just 28.4 years, India is far younger than many developed countries whose median ages often exceed 40. Each year, approximately twelve million young people enter the labor market, creating both an opportunity and a challenge to generate sufficient employment. By 2030, India is expected to be home to seven megacities and more than 600 million urban residents, fueling demand for housing, infrastructure, transportation, and services.

Indian People pop art posters & prints by Maju ngiwir - Printler

Illustration 12: India’s population is very young something that can become its great asset.

The key to harnessing this demographic dividend lies in education and skills training to ensure that young Indians are productive contributors to the economy rather than unemployed or underemployed.

India’s cultural richness and heritage form a vital pillar of its economy. The country attracted more than 17 million tourists in 2023, contributing significantly to local economies.


Beyond the traditional pilgrimage and heritage tourism sectors, India’s global influence is bolstered by Bollywood, yoga, cuisine, cricket, and festivals that resonate worldwide. The Indian diaspora, numbering over 30 million people globally, acts as a powerful cultural and economic bridge, enhancing India’s soft power and international reputation.

Rajshree...... Sagaai 1966

Illustration 13: A Bollywood poster

India’s role in global trade continues to expand rapidly. As the world’s ninth-largest exporter of goods and sixth-largest importer, India’s export basket includes refined petroleum, gems and jewelry, pharmaceuticals, automobiles and parts, and software services. The United States, China, the United Arab Emirates, the European Union, and ASEAN nations are India’s most significant trading partners.

India is actively negotiating free trade agreements with major economies like the UK and the EU and is building regional supply chains to reduce reliance on China and enhance economic resilience. On the global stage, India positions itself as a leading voice for the developing world, championing issues such as debt relief, food security, and climate action, especially during its G20 presidency in 2

India currently holds a sovereign credit rating of “BBB-” with a stable outlook from S&P and Fitch, and a “Baa3” from Moody’s, both of which are the lowest investment-grade ratings. These ratings indicate that India is a relatively safe destination for investment, but with moderate credit risk. The scores reflect a balance between India’s strong long-term growth prospects and structural economic challenges such as a high fiscal deficit, significant public debt, and dependency on imported energy.

The rating agencies acknowledge India’s resilient and diversified economy, large domestic market, improving infrastructure, and digital innovation as strengths. India’s track record of stable democratic governance, reforms in taxation (like GST), and emphasis on infrastructure and ease of doing business further support its rating. However, concerns remain over fiscal discipline, with the government debt-to-GDP ratio hovering around 83%, and recurring fiscal deficits above 5%, driven by subsidies, welfare schemes, and lower tax revenues.

Despite global economic uncertainties, India’s strong GDP growth, estimated at around 6–7% annually, even during volatile periods, continues to reinforce investor confidence. Many experts believe that with continued reforms, improved tax collection, and responsible fiscal management, India could see a credit upgrade in the coming years, which would lower borrowing costs and attract more foreign investment.

Despite its impressive rise, India faces deep-seated challenges. Income inequality is stark, with the richest one percent controlling more than 40% of the nation’s wealth. Structural issues such as unemployment. especially among youth and graduates, remain unresolved. While India has made strides in reducing corruption and improving ease of doing business, bureaucratic inertia and red tape still hinder many entrepreneurs.


Environmental problems loom large as well. Air pollution in cities frequently reaches hazardous levels, water scarcity threatens agriculture and urban centers, and climate change presents an existential risk to development gains. Public debt, while moderate compared to many developed nations, is rising and will require careful fiscal management.

INEQUALITY IN INDIA | IAS Gyan

Illustration 14: Ambani tower in India highlighting the difference between rich and poor in the country.

Looking forward, India has set ambitious goals to become a $5 trillion economy by 2027 and to join the ranks of the world’s top three economic powers by 2050. The government’s vision of “Viksit Bharat,” or Developed India, aims for transformational progress by the centenary of independence in 2047.

Priority sectors include renewable energy, where India is already a global leader in solar power and has pledged to reach net-zero carbon emissions by 2070. Defense manufacturing, advanced technologies such as artificial intelligence and quantum computing, biotechnology, and infrastructure development are all central to India’s future growth plans.

Massive investments in freight corridors, expressways, and ports are underway to improve logistics and connect the vast country more efficiently.

India’s economy embodies a unique paradox. It is ancient and modern, fast-growing yet uneven, chaotic yet bursting with creative energy. Unlike the more streamlined and centralized economies of Germany or China, India’s democratic capitalism is messy and vibrant, shaped by millions of individual decisions, countless startups, and an energetic population.

Commentary: Why India will become a superpower - CNA

Illustration 15: India is one of the fastest growing economies in the world.

Its rise is not just an economic story but a human one, about a nation harnessing its vast potential, striving to lift hundreds of millions out of poverty, and aiming to reshape the global economic order. As smartphones proliferate in small towns, solar panels spread across deserts, and coding campuses thrive in Bangalore and Hyderabad, India is writing a new chapter in the story of global growth.

India’s economy is a dynamic blend of traditional strength and modern innovation, driven by a powerful services sector, a vast and evolving agricultural base, and a rapidly growing industrial and manufacturing ecosystem. With a young population, expanding digital infrastructure, and consistent GDP growth averaging 6–7%, India is well-positioned to become one of the world’s leading economic powers. However, to fully unlock its potential, the country must address key challenges like unemployment, low agricultural productivity, infrastructure gaps, and fiscal discipline, while continuing to invest in reforms, technology, and human capital.

The Indian Economy: A sleeping Giant

India is more than just a country, it is a civilization that spans thousands of years, a vibrant continent in its own right, and an economic marvel constantly in motion. With a history that stretches back over five millennia, India remains one of the world’s oldest cultures while simultaneously being one of the youngest and fastest-growing economies on the planet.

Fil:Flag of India.svg – Wikipedia

Today, it stands as the most populous nation on Earth, the fifth-largest economy by nominal GDP, and a powerhouse of innovation and entrepreneurship. The economy of India is a developing mixed economy with a notable public sector in strategic sectors.

Known as the world’s largest democracy, India is a federal republic composed of 28 states and 8 union territories. It is a nuclear-armed nation, a member of influential groups such as the G20, BRICS, and the World Trade Organization, and holds a pivotal position in the Indo-Pacific region both strategically and economically.

As of 2024, India’s nominal GDP reached nearly $3.9 trillion, edging past the United Kingdom and approaching the size of Germany’s economy. When measured in purchasing power parity terms, India ranks third globally behind China and the United States. This remarkable economic ascent is fueled by a young and expanding population of 1.44 billion people, a rapidly growing middle class, and a labor force increasingly skilled in technology and services.

his article explores the complex and fascinating story of India’s economic evolution, from its early days of immense wealth through the hardships of colonialism, the challenges of socialist policies, and finally the remarkable liberalization that catapulted the nation into the global spotlight. Whether you are an investor, student, or simply curious about global affairs, India’s economic journey offers profound lessons in resilience, ambition, and transformation.

India’s history as an economic power dates back thousands of years, when it accounted for roughly a quarter to a third of the world’s GDP. During ancient times, great empires such as the Mauryas, Guptas, Cholas, and later the Mughals presided over prosperous kingdoms that exported textiles, spices, gems, and rich cultural knowledge to distant lands. India’s early economy was sophisticated and globally connected, making it one of the wealthiest regions on Earth.


India’s history as an economic power dates back thousands of years, when it accounted for roughly a quarter to a third of the world’s GDP. During ancient times, great empires such as the Mauryas, Guptas, Cholas, and later the Mughals presided over prosperous kingdoms that exported textiles, spices, gems, and rich cultural knowledge to distant lands. India’s early economy was sophisticated and globally connected, making it one of the wealthiest regions on Earth.

Art of Legend India: Art, Paintings, Handicrafts, Jewelry, Beads, Handmade  Items: Mughal School of Arts - Mixture Style of Indian and Persian Art

Illustration 2: Mughal Empire of India

However, the arrival of European colonial powers, especially the British East India Company in the 18th century, marked a profound shift. What was once a manufacturing and trading powerhouse became a supplier of raw materials and a captive market for British goods.

The colonial period saw the systematic deindustrialization of India’s traditional industries, such as the famous textile mills of Bengal, and the extraction of wealth that hindered economic progress for nearly two centuries. By the time India gained independence in 1947, its share of the global economy had dwindled to a mere 3%, a shadow of its former glory.

Life Size Portrait Painting Of Indian Raja Or Emperor

Illustration 3: British India led to India falling from making up 22.6% of the world economy in 1700 to 3.8% in 1952.

After independence, India embarked on a path shaped by the vision of Prime Minister Jawaharlal Nehru, who championed a socialist-inspired model of economic development. The state took control of key industries such as heavy manufacturing, banking, railways, and energy.

While this helped establish a basic industrial base, it also resulted in the notorious “License Raj,” a cumbersome system of permits and bureaucratic controls that stifled entrepreneurship and economic dynamism. For decades, India’s growth rate lingered at a modest 3 to 4 percent, a pace so slow it was mockingly dubbed the “Hindu rate of growth.

The turning point came in 1991 when a severe balance of payments crisis forced India to fundamentally rethink its economic model. Led by Finance Minister Manmohan Singh, the government embarked on sweeping reforms that dismantled import restrictions, reduced subsidies, and opened the economy to foreign investment. This liberalization unleashed a wave of economic activity that transformed India into a global player. The IT sector boomed, telecom networks expanded, pharmaceutical companies grew to global prominence, and financial markets developed rapidly. India’s economy accelerated, foreign reserves surged, and the nation gained credibility on the world stage.


India’s economy is broadly divided into three main sectors: agriculture, industry, and services. Together, these sectors weave a complex and sometimes contradictory tapestry. While agriculture still employs the largest share of the workforce, roughly 43% of the population, it accounts for only about 20% of GDP.

Twin Size Star Mandala Tapestry Cute Indian Wall Hanging Twin Bedding

Illustration 4: The Indian economy is complex like a tapestry

Industry contributes around a quarter of the GDP and employs about a quarter of the labor force. The services sector dominates the economy, representing more than half of the country’s GDP, yet employs only about a third of the workers. This structural imbalance highlights some of India’s greatest development challenges but also points to immense opportunities for growth and modernization.’

Historically a late bloomer in manufacturing, India has increasingly turned its attention to industrial development. The government’s flagship initiative, “Make in India,” aims to expand the manufacturing sector’s share of GDP to 25 percent.

he automobile sector is one of the largest in the world, with companies like Tata Motors, Mahindra & Mahindra, bajaj auto, TVS motor company, Atul Auto and Maruti Suzuki producing millions of vehicles annually. As of 2023, India ranked as the fourth-largest automobile producer in the world, following China, United States and Japan. T

he sector accounts for approximately 7.1% of India’s GDP and employs over 37 million people directly and indirectly. As of April 2022, India’s auto industry is worth more than US$100 billion and accounts for 8% of the country’s total exports and 7.1% of India’s GDP.

Delhi Sightseeing by Tuk Tuk 2025 - New Delhi

Illustration 5: India is one of the world’s largest producers of tuk tuks

The pharmaceutical industry, often called the “pharmacy of the world,” manufactures 60 percent of the world’s vaccines and is a global leader in generic drugs. Heavy industries such as steel, cement, and chemicals are dominated by conglomerates like Tata Steel and Aditya Birla Group.

India is also carving a niche in emerging industries such as semiconductors, solar energy equipment, and electric vehicles, with states like Gujarat and Tamil Nadu competing fiercely to attract large factories and investment. Defense manufacturing is another growing priority, as India seeks to reduce its dependence on arms imports and develop indigenous capabilities.

Mining contributed to 1.75% of GDP and employed directly or indirectly 11 million people in 2021. India’s mining industry was the fourth-largest producer of minerals in the world by volume, and eighth-largest producer by value in 2009.


In output-value basis, India was one of the five largest producers of mica, chromite, coal, lignite, iron ore, bauxite, barite, zinc and manganese; while being one of the ten largest global producers of many other minerals.

rajasthan tourism decorative collage with traditional culture 40519472  Vector Art at Vecteezy

Illustration 6: Rajesthan is one of the indian states with the most natural resources

Indian cement industry is the 2nd largest cement producing country in the world, next only to China. At present, the Installed Capacity of Cement in India is 500 MTPA with production of 298 million tonnes per annum. Majority of the cement plants installed capacity (about 35%) is located in the states of south India. 

India surpassed Japan as the second largest steel producer in January 2019.The country’s steel sector benefits from abundant iron ore reserves, a large labor force, and strong government support through initiatives like Make in India” and the National Steel Policy. As demand for steel rises both domestically and globally, India continues to expand its production capacity and export footprint.

Petroleum products and chemicals are a major contributor to India’s industrial GDP, and together they contribute over 34% of its export earnings. India hosts many oil refinery and petrochemical operations developed with help of Soviet technology such as Barauni Refinery and Gujarat Refinery, it also includes the world’s largest refinery complex in Jamnagar that processes 1.24 million barrels of crude per day.

By volume, the Indian chemical industry was the third-largest producer in Asia, and contributed 5% of the country’s GDP. India is one of the five-largest producers of agrochemicals, polymers and plastics, dyes and various organic and inorganic chemicals. Despite being a large producer and exporter, India is a net importer of chemicals due to domestic demands. India’s chemical industry is extremely diversified and estimated at $178 billion.

India is one of the largest producers and consumers of chemicals and fertilizers in the world, with the chemical industry contributing over 7% to the country’s GDP and ranking 6th globally in chemical production. At present, 57 large fertilizer units are manufacturing a wide number of nitrogen fertilizers. These include 29 urea-producing units and 9 ammonia sulfate-producing units as a by-product. Besides, there are 64 small-scale producing units of single super phosphate.

The fertilizer sector, vital for India’s agriculture, produced around 43.7 million tonnes of fertilizers in 2024–25, including urea, DAP, and complex fertilizers, supported by government subsidies and increasing adoption of nutrient-based fertilizers. The growing demand from agriculture, textiles, and pharmaceuticals continues to drive expansion in both sectors.

Colorful Dyes At Indian Market by Photo By Meredith Narrowe

Illustration 7: India is one of the largest producers of dye in the world.


Furthermore, when it comes to transportation India is the third-largest domestic aviation market in the world, with passenger traffic reaching over 280 million in 2023. As of 2024, the country has 149 operational airports, up from 74 in 2014, and the government plans to expand this to 220 airports by 2030 under a 1 trillion Indian rupees infrastructure push.

India’s railways, contributing about 2% to the country’s GDP, transport over 8 billion passengers and 1.2 billion tonnes of freight annually, making it one of the world’s largest and busiest rail networks. The sector supports around 7 million jobs, both directly and indirectly, playing a crucial role in driving economic growth and connecting markets across the nation. With ongoing investments in modernization, electrification, and high-speed rail, Indian Railways is set to boost productivity and sustainability even further.

This London Landmark Inspired A Stunning Train Station In Mumbai

Illustration 8: Mumbai train station

India also has multiple ship building companies such as Cochin Shipyard, Hindustan Shipyard and Swan Defence and Heavy Industries, mainly produces ships for European, South American and African shipping companies. Cochin shipyard is the pioneer in autonomous electric propulsion ships.

Agriculture remains the cornerstone of India’s socio-economic landscape, deeply intertwined with the lives of over 40% of the population who depend on it for their livelihoods. Despite its declining share of around 16-17% in the country’s GDP, the sector is critical for ensuring food security, sustaining rural communities, and maintaining social stability across vast regions.

India proudly holds the title as the world’s largest producer of milk, pulses, and spices, and is among the top global producers of staples like rice, wheat, sugarcane, cotton, and a wide variety of fruits and vegetables, feeding over 1.4 billion people.

Yet, beneath this agricultural abundance lies a paradox: low productivity and fragmented landholdings often limit farmers’ incomes and economic resilience. Most farms are small, averaging less than 2 hectares, which constrains the adoption of advanced technology and efficient farming practices.

Additionally, frequent climate shocks, such as droughts, floods, and erratic monsoons, leave millions vulnerable and threaten crop yields year after year. Infrastructure challenges, including inadequate irrigation, poor storage facilities, and inefficient supply chains, further reduce farmers’ ability to maximize profits and reach larger markets.


The glorious history of India's passion for tea, in eight images

Illustration 9: India is one of the largest producers of tea

Recognizing these challenges, India has embarked on a path to modernize agriculture by investing in better irrigation systems, promoting mechanization, improving rural roads and cold storage, and embracing digital technologies like satellite imaging and mobile apps to provide real-time information to farmers.

India’s agriculture and allied sectors remain a vital part of the economy, accounting for 18.4% of GDP and employing nearly 46% of the workforce, despite the sector’s shrinking share in overall economic output, from 52% in 1951 to around 15% in 2023.

The country boasts the largest arable land area in the world, ranking as a top global producer of milk, pulses, spices, rice, wheat, sugarcane, cotton, fruits, and vegetables. However, productivity challenges persist, with yields often only 30% to 50% of global best practices due to small landholdings, inadequate irrigation (only about 39% of cultivated land is irrigated), and infrastructure gaps in storage, roads, and markets. These issues limit farmers’ incomes and keep agricultural output below its full potential.

India is also a global leader in fisheries and aquaculture, ranking 3rd and 2nd respectively, providing livelihoods to millions, and exporting significant quantities of processed products like cashew kernels and milk. While the country produces roughly 316 million tonnes of foodgrains annually, stagnation in output and large post-harvest losses, up to one-third of production, highlight inefficiencies.

Government initiatives like the ₹1.2 trillion Accelerated Irrigation Benefit Programme aim to improve irrigation and infrastructure, but regulatory hurdles and market constraints continue to slow progress. Overall, India’s agriculture sector is a complex blend of immense scale, rich diversity, and urgent need for modernization to boost productivity and farmer prosperity.

Women pounding rice, India stock image | Look and Learn

Illustration 10: Indian women pounding rice, India is one of the world’s largest rice producers

However, progress has been uneven and often slowed by political sensitivities and social complexities. The massive farmer protests of 2020–21 underscored the deep-rooted concerns and emotional ties surrounding land rights, pricing, and market reforms. These protests highlighted how any attempt to transform India’s agricultural sector must carefully balance economic modernization with the protection of farmers’ livelihoods and rights.


Looking ahead, the future of Indian agriculture depends on successfully navigating this delicate balance, integrating technology and innovation while ensuring inclusivity and sustainability. With targeted reforms, climate-resilient farming practices, and strengthened rural infrastructure, India has the potential not only to feed its vast population but also to emerge as a global leader in sustainable agriculture.

The services sector has emerged as the undisputed engine of India’s economic growth, contributing a staggering over 50% of the country’s GDP, making it the largest sector in the Indian economy. From IT and software exports to financial services, healthcare, education, telecommunications, tourism, logistics, and more. the breadth and dynamism of this sector reflect India’s transition from a primarily agrarian economy to a global services leader.

At The Char Minar In Hyderabad by Print Collector

Illustration 11: The city of Hyderabad is becoming a global hub for IT.

Cities like Bengaluru, Hyderabad, Gurugram, and Pune have become world-renowned hubs for IT, software development, business process outsourcing (BPO), and innovation, attracting investments from global tech giants and startups alike.

India’s Information Technology and Business Process Management (IT-BPM) sector alone generated over $250 billion in revenue in 2023, employing more than 5 million professionals, and contributing significantly to foreign exchange earnings.

Indian IT firms serve clients across the globe, from Silicon Valley startups to Fortune 500 corporations, delivering everything from cloud computing to AI solutions. Beyond tech, India’s financial services sector, anchored by robust public and private banks, insurance companies, fintech startups, and stock exchanges like NSE and BSE, plays a pivotal role in capital formation and investor confidence.

India’s telecom sector is a global giant, now the second-largest market in the world with over 1 billion phone subscribers and one of the lowest call tariffs due to intense competition. In FY 2024, telecom equipment production crossed ₹45,000 crore, with exports hitting ₹10,500 crore, driven by the booming smartphone manufacturing industry. India also ranks among the top three globally in internet users, and is the largest DTH television market by subscribers making digital connectivity a key pillar of its economic growth.

Equally significant is the rise of tourism, healthcare, education, retail, e-commerce, and digital services, all of which are rapidly expanding with the growing urban middle class and increasing internet penetration. The Unified Payments Interface (UPI) revolutionized digital transactions, processing billions of transactions monthly, and helped formalize vast segments of the economy. Meanwhile, the services sector has also become a major employment generator, especially in urban and semi-urban areas, offering opportunities in both high-skilled and low-skilled segments.

The government’s focus on initiatives like Digital India, Skill India, and Start-Up India further accelerates the services sector’s potential, promoting entrepreneurship, digital infrastructure, and employment. However, to sustain this momentum, India must address key challenges, such as improving ease of doing business, upskilling the workforce, enhancing service exports, and bridging the digital divide in rural areas.


In essence, the services sector is not just a component of India’s economy, it is its beating heart, transforming the country into a knowledge-based, innovation-driven powerhouse that is well on its way to becoming a major player in the global economic landscape.

India’s 63 million MSMEs (Micro, Small, and Medium Enterprises) contribute 35% to GDP, employ over 111 million people, and make up 40% of exports, earning their title as the “growth engines” of the economy. Though 90% are micro-enterprises with limited scale, 2023 saw a record 179 SME IPOs, showing rising investor interest. With continued policy support and reforms, MSMEs hold the key to tackling unemployment and driving inclusive growth.

India’s digital transformation has been nothing short of revolutionary. Central to this has been the Unified Payments Interface (UPI), a real-time digital payment system that processes billions of transactions monthly, outpacing even the combined digital payments of the US, China, and the EU. The Aadhaar biometric identification system has provided over 1.3 billion Indians with a unique digital identity, enabling unprecedented access to banking, government services, and welfare programs.

Together with the Jan Dhan-Aadhaar-Mobile (JAM) trinity, these innovations have democratized access to finance and services across vast rural and urban populations. The government’s Digital India initiative aims to further embed technology into governance, business, and daily life, while targeted programs such as Startup India and the Semiconductor Mission are propelling innovation and domestic manufacturing.

Furthermore, India’s youthful population is one of its greatest assets. With a median age of just 28.4 years, India is far younger than many developed countries whose median ages often exceed 40. Each year, approximately twelve million young people enter the labor market, creating both an opportunity and a challenge to generate sufficient employment. By 2030, India is expected to be home to seven megacities and more than 600 million urban residents, fueling demand for housing, infrastructure, transportation, and services.

Indian People pop art posters & prints by Maju ngiwir - Printler

Illustration 12: India’s population is very young something that can become its great asset.

The key to harnessing this demographic dividend lies in education and skills training to ensure that young Indians are productive contributors to the economy rather than unemployed or underemployed.

India’s cultural richness and heritage form a vital pillar of its economy. The country attracted more than 17 million tourists in 2023, contributing significantly to local economies.


Beyond the traditional pilgrimage and heritage tourism sectors, India’s global influence is bolstered by Bollywood, yoga, cuisine, cricket, and festivals that resonate worldwide. The Indian diaspora, numbering over 30 million people globally, acts as a powerful cultural and economic bridge, enhancing India’s soft power and international reputation.

Rajshree...... Sagaai 1966

Illustration 13: A Bollywood poster

India’s role in global trade continues to expand rapidly. As the world’s ninth-largest exporter of goods and sixth-largest importer, India’s export basket includes refined petroleum, gems and jewelry, pharmaceuticals, automobiles and parts, and software services. The United States, China, the United Arab Emirates, the European Union, and ASEAN nations are India’s most significant trading partners.

India is actively negotiating free trade agreements with major economies like the UK and the EU and is building regional supply chains to reduce reliance on China and enhance economic resilience. On the global stage, India positions itself as a leading voice for the developing world, championing issues such as debt relief, food security, and climate action, especially during its G20 presidency in 2

India currently holds a sovereign credit rating of “BBB-” with a stable outlook from S&P and Fitch, and a “Baa3” from Moody’s, both of which are the lowest investment-grade ratings. These ratings indicate that India is a relatively safe destination for investment, but with moderate credit risk. The scores reflect a balance between India’s strong long-term growth prospects and structural economic challenges such as a high fiscal deficit, significant public debt, and dependency on imported energy.

The rating agencies acknowledge India’s resilient and diversified economy, large domestic market, improving infrastructure, and digital innovation as strengths. India’s track record of stable democratic governance, reforms in taxation (like GST), and emphasis on infrastructure and ease of doing business further support its rating. However, concerns remain over fiscal discipline, with the government debt-to-GDP ratio hovering around 83%, and recurring fiscal deficits above 5%, driven by subsidies, welfare schemes, and lower tax revenues.

Despite global economic uncertainties, India’s strong GDP growth, estimated at around 6–7% annually, even during volatile periods, continues to reinforce investor confidence. Many experts believe that with continued reforms, improved tax collection, and responsible fiscal management, India could see a credit upgrade in the coming years, which would lower borrowing costs and attract more foreign investment.

Despite its impressive rise, India faces deep-seated challenges. Income inequality is stark, with the richest one percent controlling more than 40% of the nation’s wealth. Structural issues such as unemployment. especially among youth and graduates, remain unresolved. While India has made strides in reducing corruption and improving ease of doing business, bureaucratic inertia and red tape still hinder many entrepreneurs.


Environmental problems loom large as well. Air pollution in cities frequently reaches hazardous levels, water scarcity threatens agriculture and urban centers, and climate change presents an existential risk to development gains. Public debt, while moderate compared to many developed nations, is rising and will require careful fiscal management.

INEQUALITY IN INDIA | IAS Gyan

Illustration 14: Ambani tower in India highlighting the difference between rich and poor in the country.

Looking forward, India has set ambitious goals to become a $5 trillion economy by 2027 and to join the ranks of the world’s top three economic powers by 2050. The government’s vision of “Viksit Bharat,” or Developed India, aims for transformational progress by the centenary of independence in 2047.

Priority sectors include renewable energy, where India is already a global leader in solar power and has pledged to reach net-zero carbon emissions by 2070. Defense manufacturing, advanced technologies such as artificial intelligence and quantum computing, biotechnology, and infrastructure development are all central to India’s future growth plans.

Massive investments in freight corridors, expressways, and ports are underway to improve logistics and connect the vast country more efficiently.

India’s economy embodies a unique paradox. It is ancient and modern, fast-growing yet uneven, chaotic yet bursting with creative energy. Unlike the more streamlined and centralized economies of Germany or China, India’s democratic capitalism is messy and vibrant, shaped by millions of individual decisions, countless startups, and an energetic population.

Commentary: Why India will become a superpower - CNA

Illustration 15: India is one of the fastest growing economies in the world.

Its rise is not just an economic story but a human one, about a nation harnessing its vast potential, striving to lift hundreds of millions out of poverty, and aiming to reshape the global economic order. As smartphones proliferate in small towns, solar panels spread across deserts, and coding campuses thrive in Bangalore and Hyderabad, India is writing a new chapter in the story of global growth.

India’s economy is a dynamic blend of traditional strength and modern innovation, driven by a powerful services sector, a vast and evolving agricultural base, and a rapidly growing industrial and manufacturing ecosystem. With a young population, expanding digital infrastructure, and consistent GDP growth averaging 6–7%, India is well-positioned to become one of the world’s leading economic powers. However, to fully unlock its potential, the country must address key challenges like unemployment, low agricultural productivity, infrastructure gaps, and fiscal discipline, while continuing to invest in reforms, technology, and human capital.

UnitedHealth Group – A Stock Analysis of One of the Leading Healthcare Giants in the World

UnitedHealth Group Incorporated is a leading American multinational healthcare and insurance company, widely recognized as one of the world’s most powerful players in health services, technology-driven care solutions, and managed healthcare.

UnitedHealthcare's Medicare Advantage Plans Review | SeniorLiving.org

Illustration 1: The UnitedHealth Group logo – symbolizing trust

Headquartered in Minnetonka, Minnesota, UnitedHealth is best known for its massive scale in health insurance through its UnitedHealthcare brand, but it also operates the highly influential Optum segment, which focuses on data analytics, pharmacy services, care delivery, and tech-enabled health solutions.

While traditional health insurers operate in narrow verticals, UnitedHealth has evolved into a diversified, tech-integrated healthcare conglomerate. Its model focuses not only on coverage but on driving improved patient outcomes, reducing healthcare costs, and leveraging digital solutions to reshape modern medicine.

UnitedHealth consistently ranks among the top Fortune 500 companies by revenue, often trailing only global titans like Walmart and Amazon. Its scale, data assets, and vertically integrated services place it at the forefront of the healthcare industry’s transformation.

$2.5M UnitedHealthcare TCPA class action settlement

Illustration 2: UnitedHealthcare headquarters in Minnetonka, Minnesota

A major turning point in the company’s evolution came in 2011 with the creation of Optum, a health services platform designed to address systemic inefficiencies in American healthcare. Optum was split into three divisions: Optum Health, which focuses on direct clinical care and outpatient services; Optum Insight, which manages data analytics and technology solutions; and Optum Rx, which handles pharmacy benefit management and prescription drug services.


Over the past decade, Optum has become a vital engine of growth for UnitedHealth Group, accounting for nearly half of the company’s total revenue. Its integration of tech-driven healthcare with clinical and administrative services has allowed UnitedHealth to become far more than just an insurer, it is now a platform company with deep influence across every major component of the health economy.

UnitedHealth Group founder to retire from the board after more than 40 years

Illustration 3: Richard Burke founder of UnitedHealthcare

Today, UnitedHealth Group operates in all 50 U.S. states and increasingly abroad. Its insurance division remains the largest private health insurer in the United States, while Optum is one of the country’s largest employers of doctors, one of the biggest processors of healthcare data, and one of the top pharmacy service providers.

UnitedHealth Group operates through two core business segments which is 1. UnitedHealthcare and 2. Optimum

At the heart of its operational engine is the UnitedHealthcare division, which administers health insurance to over 50 million Americans across employer-sponsored plans, Medicare Advantage, Medicaid, individual exchanges, and military health programs.

This division handles millions of claims per day, coordinates provider networks, manages risk pools, and ensures regulatory compliance in all 50 states and abroad. Its operations rely heavily on automation, proprietary algorithms, and customer service teams trained to navigate the complex U.S. healthcare landscape.

Optum , is a health services platform divided into: Optum Health which is a clinical services including surgery centers, primary care, urgent care, and behavioral health, Optum Insight which is a data analytics, software, and AI-driven platforms used by providers and governments and Optum Rx which is a pharmacy care services including PBM (pharmacy benefit management) operations.

Team Of Doctors And Nurses Doing Surgery To Their Patient Vector  Illustration PNG Images | EPS Free Download - Pikbest

Illustration 4: UnitedHealth is the largest employer of doctors in the US


What makes UnitedHealth Group truly stand out from traditional insurers is its deep integration of technology and healthcare data. Through its Optum Insight division, the company manages one of the largest health analytics operations in the world.

It works with health systems, governments, and employers to create AI-based tools that can detect patterns in patient data, identify at-risk populations, reduce readmissions, and optimize treatment pathways.

UnitedHealth now says 190 million impacted by 2024 data breach

Illustration 5: UnitedHealth is on the forefront in the interconnection of AI and medicine.

The company’s focus on digital tools also includes consumer-facing products. Members of UnitedHealthcare plans can use mobile apps to track claims, compare procedure costs, and receive virtual care. The company is increasingly shifting toward value-based care, where hospitals and doctors are rewarded not for the number of procedures they perform, but for the outcomes they deliver.

UnitedHealth is at the forefront of this movement, offering financial incentives to physicians who reduce avoidable hospitalizations, control chronic conditions, and improve patient satisfaction.

UnitedHealth Maintains the Hack Won't Have an Impact. That's Harder to  Believe Now. - Barron's

Illustration 6: UnitedHealth make use of app and other new technology in healthcare

UnitedHealth is also a massive player in behavioral health, a segment of care that has grown significantly in demand since the COVID-19 pandemic. Its services in teletherapy, psychiatric care, and substance use treatment now reach millions of Americans.

UnitedHealth Group operates in a fiercely competitive landscape that spans health insurance, data analytics, pharmacy benefit management, and digital health.

1. Helath Insurance

CVS Health / Aetna has become a vertically integrated healthcare player, and its ability to cross-sell insurance with retail and pharmacy services poses a long-term strategic challenge to UnitedHealth


Anthem (Elevance Health) is one of the largest Blue Cross Blue Shield affiliates, offering strong competition in employer-sponsored and Medicaid health plans,, but lacks the services depth of Optum.


Cigna focuses on commercial insurance and owns Express Scripts, giving it strength in employer plans and pharmacy benefit management. Cigna’s model is leaner and more focused, but lacks the vertical integration that gives UnitedHealth its scalability and efficiency edge.

2. Health Technology and Services

Centene dominates in Medicaid and ACA exchanges, often underpricing rivals to win contracts, which pressures margins for everyone. Centene’s strength in low-income markets exposes UnitedHealth to pricing pressure, though UHG typically competes with better operational efficiency and outcomes.

Humana is a pure play in Medicare Advantage and is investing aggressively in home health and chronic care, areas that overlap with Optum Health.

Amazon has entered healthcare with One Medical and Amazon Clinic, using its tech expertise and logistics network to disrupt primary care and telehealth. Amazon’s entry is early-stage but significant if it scales, it could threaten Optum’s retail clinic and digital engagement strategies over time.

3. Pharmacy and PBM Players

Express Scripts, owned by Cigna, remains a top PBM and competes directly with Optum Rx in controlling drug spending and managing large employer accounts.

CVS Caremark, part of CVS Health, handles PBM services for millions and leverages its in-store footprint to drive pharmacy traffic.

Health Insurance Companies in India in 2025 Approved by IRDAI

Illustration 7; Health Insurance is a big part of UnitedHealth’s expenses

Walgreens Boots Alliance is expanding into primary care via partnerships and acquisitions, aiming to become a service-based health company rather than just a retail chain.

UnitedHealth’s greatest strategic advantage lies in its vertical integration. By owning the insurance business, the care delivery network, the pharmacy services infrastructure, and the data analytics tools, the company is able to control both the cost and quality of care in a way that few others can replicate.

Its scale gives it access to data on tens of millions of patients, allowing it to build predictive models that improve care outcomes and drive down costs.


Its brand is trusted by employers, providers, and patients alike. And its ongoing investment in technology ensures that it is not just keeping pace with the transformation of healthcare, it is leading it.

Rather than waiting for the future of healthcare to arrive, UnitedHealth is actively building it, one acquisition, data platform, and clinic at a time.

As the healthcare industry undergoes rapid transformation toward digitization, personalization, and value-based care, UnitedHealth Group appears better positioned than any other company to thrive.

Healthcare medical cartoon | Premium Vector

Illustration 8: The outlook of UnitedHealth looks healthy

The company has outlined ambitious growth targets, including expanding its Medicare Advantage footprint, increasing the reach of its clinical care network under Optum Health, and leveraging its data platforms to deliver AI-driven solutions for both public and private sector clients.

International expansion is also on the horizon, with the company targeting opportunities in India, South America, and Europe. At the same time, domestic healthcare spending continues to rise, driven by aging demographics and chronic disease management, ensuring sustained demand for UnitedHealth’s services.

By 2026, UnitedHealth projects that annual revenue will exceed $450 billion, with much of that growth coming from the continued integration of insurance and care delivery. Its long-term vision is to be the digital backbone of healthcare—a platform that processes claims, delivers care, dispenses medications, and improves outcomes across the entire continuum of health.


In this section we will analyze UnitedHealth Group’s stock to see if it is a good stock to buy or not. Our philosophy is value investing meaning that we try to find good quality companies that are undervalued. However, we will give a holistic overview so all kind of investors with different philosophies can judge the stock for themselves.

Revenue and Profits

Illustration 9 and 10: Revenue of UnitedHealth Group from 2009 to 2025

As shown in Illustrations 9 and 10, UnitedHealth Group has delivered steady and consistent revenue growth, rising from approximately USD 87 billion in 2009 to over USD 400 billion in 2025. This long-term upward trend, with no major drops or erratic spikes, signals operational discipline, a resilient business model, and effective long-term planning.

Even during disruptive events like the COVID-19 pandemic and broader macroeconomic uncertainty, UnitedHealth continued to grow thanks to its diversified structure across insurance, pharmacy benefits, and healthcare services. The expansion of Optum, its data, technology, and clinical care platform, has added a high-growth, high-margin engine alongside its core insurance operations.

In short, UnitedHealth’s financial performance sends a strong green flag to long-term investors. It has demonstrated resilience through crises, maintained consistent top-line expansion, and continues to evolve through innovation and scale, all signs of a mature, well-managed company with staying power.

Illustration 11 and 12: Net Income of UnitedHealth Group from 2009 to 2025

Net income is a crucial metric to evaluate when determining whether a company is a worthwhile investment. It represents a company’s net profit or loss after accounting for all revenues, income items, and expenses, calculated as Net Income = Revenue – Expenses.

As seen in Illustrations 11 and 12, UnitedHealth Group’s net income had followed a remarkably steady upward trajectory for over a decade, closely aligned with its revenue growth. However, 2023–2024 marked a sharp departure from that trend, with net income taking an unexpected dip. This drop was primarily triggered by higher-than-expected medical care costs, particularly a spike in outpatient surgeries and elective procedures as patients resumed care that had been delayed during the pandemic. Additionally, increased regulatory scrutiny and pricing pressure in the Medicare Advantage space placed added stress on margins, especially as competitors intensified their push into the same market.

While the decline was noticeable, it’s important to put it in context. This was not a structural failure or sign of long-term weakness, but rather a short-term correction after years of strong growth. UnitedHealth has already responded by adjusting its pricing strategy, tightening cost controls, and expanding high-margin segments within Optum.

For investors, this dip is worth noting, but not panicking over. If anything, it serves as a reminder that even healthcare giants are not immune to volatility in utilization trends. That said, UnitedHealth’s strong fundamentals, diversified operations, and rapid operational response suggest this was a temporary setback, not a red flag for the company’s long-term outlook.

Revenue Breakdown

UnitedHealth Group Inc's Meteoric Rise: Unpacking the 17% Surge in Just 3  Months

Illustration 13: Revenue breakdown of UnitedHealth Group made by gurufocus.

As shown in Illustration 13, UnitedHealth Group’s core health insurance operations remain the primary driver of revenue, consistently contributing the vast majority of total income around 77%. This includes its broad portfolio of commercial insurance plans, Medicare Advantage, Medicaid services, and individual health plans, which together serve millions of members across the United States. UnitedHealth’s extensive network and scale provide it with a competitive edge, enabling stable growth and strong member retention.

Optum Rx, responsible for pharmacy benefit management, represents approximately 12% of revenue. By leveraging extensive data analytics and scale, Optum Rx negotiates drug prices and manages medication use to control overall costs. The segment faces challenges from rising drug prices and regulatory scrutiny, which can pressure margins. Still, its operational efficiency and technological capabilities help maintain strong profitability.ver

Optum Health contributes about 9% of revenue and focuses on delivering integrated care services such as primary care, ambulatory care, and home-based services. This segment invests heavily in care infrastructure and value-based care models, which can increase operating costs in the short term. However, these investments aim to reduce long-term healthcare expenses by improving patient outcomes and lowering hospitalizations, positioning Optum Health as a key driver of future growth in a shifting healthcare landscape.

Optum Insight makes up about 1.6% of revenue and provides health IT, data analytics, and consulting services to healthcare providers and payers. This segment has relatively lower costs compared to others and offers high-margin growth potential as demand for healthcare technology and analytics expands.

UnitedHealth balances costs and investments by leveraging UnitedHealthcare’s scale to manage claims volatility and Optum’s innovation to drive efficiency. Despite high costs from medical claims and services, this approach supports steady revenue growth and stable margins, making it a strong choice for investors seeking resilience and growth.

Earnings per Share

Illustration 14; Earnings per share for UnitedHealth Group from 2009 to 2024

Earnings Per Share (EPS) is a crucial measure of how much profit UnitedHealth Group generates for each share of its stock, offering insight into its profitability and financial health. For investors, what truly matters is consistent growth in EPS over time, which signals strong performance and long-term value.

The EPS figure itself isn’t the primary focus for value investors, it can be 0.2 or 10, but what truly matters is the company’s ability to generate consistent earnings growth. A steadily increasing EPS over time signals strong financial health, profitability, and long-term value creation.

UnitedHealth’s EPS showed steady growth for years, reflecting its ability to deliver reliable profits through diversified healthcare services and efficient operations. However, there was a noticeable drop in EPS from 2023 to 2024, mainly due to increased medical claims costs and investments in new care initiatives. While this decline might raise some concerns, it’s important to see it in context: UnitedHealth is investing heavily in innovation and expanding its services, which could drive future growth.

Overall, the company’s strong track record of EPS growth combined with its strategic investments suggests resilience and potential for recovery, making it a compelling option for investors focused on long-term gains rather than short-term fluctuations.

Assets and Liabilities

Illustration 15 and 16: Assets and Liabilities for UnitedHealth Group from 2009 to 2024

When sizing up UnitedHealth Group as an investment, it’s like checking under the hood before buying a car, you want to know what’s powering the engine and how well it’s maintained. UnitedHealth has been steadily growing its assets over the years, showing that its motor is strong. The total asstes have gone up from USD 59 million USD in 2009 to nearly 300 in 2024.

But here’s a twist: its cash on hand is surprisingly low compared to its debts. That’s a bit of a red flag because having limited cash means less wiggle room to handle unexpected costs or jump on new opportunities quickly. It’s like having a powerful engine but a nearly empty fuel tank, something investors need to watch closely. Its cash on hand is also significantly below its long term debt which is a red flag for potential investors. That is total liabilities has grown over time is also a red flag that should be closely monitored.

Now for the good news. UnitedHealth’s shareholder equity. the real measure of what the company owns outright, has been climbing steadily. This means it’s building solid value and managing its financial foundation well. Growing equity signals strength and stability, which is a green flag for anyone looking for a company that can weather storms and keep growing.

In short, while the tight cash situation raises some caution, the impressive rise in shareholder equity shows UnitedHealth is on a strong, responsible path. Investors should keep an eye on how it balances these factors because how UnitedHealth handles its cash and debt will shape its ability to keep leading in the fast-evolving healthcare world.

Debt to Equity Ratio

Illustration 17 and 18: Debt to equity ratio for UnitedHealth Group from 2009 to 2024

The Debt-to-Equity (D/E) ratio is an important financial metric for assessing a company’s financial leverage and risk. It compares the amount of debt the company uses to finance its operations relative to its shareholder equity. A high D/E ratio suggests that the company relies more heavily on debt to fuel growth, which could increase financial risk, especially during economic downturns when managing debt obligations becomes more challenging. In contrast, a lower D/E ratio indicates that the company is primarily financed through equity, reducing financial risk but potentially limiting its ability to rapidly expand.

Warren Buffett, a legendary value investor, typically prefers a debt-to-equity (D/E) ratio below 0.5 as a sign of conservative financial management. UnitedHealth Group’s D/E ratio was notably higher at around 2 in 2024 which is a potential red flag. In addition it’s D/E ratio has increased steadily from 2009 to 2024. This elevated level reflects the company’s significant use of debt to finance its large-scale investments in expanding healthcare services, technology, and pharmacy benefit that are areas driving its growth. While a rising D/E ratio can be a red flag signaling increased financial risk and greater leverage, it’s important to consider that UnitedHealth is strategically deploying this debt to support long-term growth. Investors should watch the trend closely, it is not neccessairly a red flag if it is using the debt to finance its growth but it should be closely monitored.

Price to earnings ratio (P/E)

Illustration 19 and 20: Price to earnings ratio for UnitedHealth Group from 2009 to 2025

For value investors, one of the first numbers worth checking when evaluating a stock like UnitedHealth Group is the price-to-earnings (P/E) ratio. It’s like the price tag on a business and just like in real life, paying too much, even for something great, can ruin the deal. Think of it this way: imagine a business that reliably earns $1 million per year. If you could buy the whole thing for just $1, you’d jump at the opportunity. But what if the owner wanted $1 trillion for it? Suddenly, the exact same business looks like a terrible investment. The stock market is no different. Companies go in and out of favor, and sometimes great businesses get temporarily mispriced. That’s when value investors pay attention.

Warren Buffett, the oracle of Omaha himself, has famously looked for companies trading at 15 times earnings or less, calling them “bargains.” Historically, UnitedHealth Group (UNH) , America’s largest health insurer , has traded well above that range, often with a P/E between 17 and 24, reflecting its strong growth, dependable cash flow, and dominant market position in a sector that rarely slows down. But here’s where things get interesting: after recent political noise surrounding Medicare Advantage and changes to reimbursement rates, UnitedHealth’s P/E ratio has dropped to around 13.

For long-term investors focused on value, this drop could be a golden opportunity. The core business remains intact. UnitedHealth continues to post strong revenue and earnings, and demand for managed care isn’t going anywhere. If anything, the recent dip looks more like a market overreaction than a true reflection of the company’s future prospects. This suggest that it is a good time for investors to buy this stock.

Price to Book Ratio (P/B)

Illustration 21 and 22: Price to book ratio for UnitedHealth Group from 2009 to 2025

When it comes to spotting value, the price-to-book (P/B) ratio is a favorite tool of seasoned investors, especially those following in Warren Buffett’s footsteps. This ratio compares a company’s stock price to the net value of its assets (book value). A P/B below 1.5 is often seen as the sweet spot, with Buffett himself known to buy in around 1.3 or lower when quality meets value. UnitedHealth Group, a dominant force in American healthcare, isn’t usually seen as a “deep value” stock — but recent events have changed the narrative. Historically trading at a P/B between 4 and 6, UnitedHealth’s valuation took a noticeable hit between late 2024 and mid-2025, driven by political pressure around Medicare Advantage, reimbursement rate shifts, and broader volatility in the healthcare sector. As a result, its P/B ratio dropped to the 3.2–3.4 range which is the lowest in years.

Now, that may not scream “cheap” compared to old-school industrials or banks. But for a healthcare juggernaut with massive scale, strong free cash flow, and a fortress balance sheet, this pullback could represent an overlooked opportunity. A lower P/B in this context suggests that the market is undervaluing the company’s underlying assets and future cash flows, not because the fundamentals are weak, but because of short-term fear .For value-oriented investors, this shift in valuation might be exactly what they wait for: a blue-chip compounder trading at a tangible discount. If UnitedHealth’s earnings power holds steady, and all signs suggest it will, this could be one of those rare windows where Wall Street’s caution creates Main Street’s opportunity.

Return on Investment (ROI)

Illustration 23 and 24: Return on investment for UnitedHealth Group from 2009 to 2025

For value investors, Return on Investment (ROI) is another vital lens for evaluating a company like UnitedHealth Group. It tells you how effectively a business turns capital into profits, not just how much it earns, but how efficiently it earns it. You wouldn’t want to invest in a company that needs $10 billion to squeeze out mediocre returns when another business can produce similar profits with half the capital. That’s where ROI comes in. It separates the capital-efficient winners from the bloated operations. A company generating high profits on lean capital is usually doing something right, and investors like Warren Buffett are always on the lookout for those with strong, sustainable returns on capital. While Buffett rarely quotes ROI directly, his investment philosophy centers around the same idea: he seeks companies that can generate 15% or more annually over time through smart capital deployment.

Historically, UnitedHealth Group has been a capital-efficiency machine, delivering ROI in the 20% range, well above most healthcare peers and more in line with what Buffett looks for. Its diversified structure, spanning insurance, pharmacy benefits, and healthcare services via Optum, has allowed it to generate strong returns with less volatility than other insurers. But in late 2024 through mid-2025, ROI slipped, dropping below 20%, a noticeable decline tied to political uncertainty, slower-than-expected growth in Medicare Advantage, and rising costs in care delivery. Some investors took it as a red flag.

But here’s the twist: even with that drop, UnitedHealth’s ROI remains competitive, especially for a highly regulated, capital-heavy industry like healthcare. And if margins normalize, which seems likely once short-term headwinds ease, returns could rebound toward historical averages. For investors focused on long-term capital efficiency, this dip may be more opportunity than concern. UnitedHealth’s track record shows disciplined spending, intelligent reinvestment, and the ability to weather policy shocks. A temporarily lower ROI doesn’t erase a decade of strong returns, but it might give value-minded investors a rare opening to buy a world-class compounder at a discount.

Dividend

Illustration 25: Dividend Payout and Yield of UNH from 2005 to 2025

UnitedHealth Group has established itself as a dependable dividend payer in the healthcare sector, offering consistent and impressive annual dividend increases over the past decade. As of 2025, the company pays a quarterly dividend of $2.10 per share, amounting to an annual payout of $8.40. This marks a significant rise from the $0.28 per share quarterly dividend paid in 2015, reflecting a more than sevenfold increase in just 10 years. Such growth underscores UnitedHealth’s commitment to delivering shareholder value while maintaining strong financial performance and disciplined capital allocation. The company’s ability to consistently raise dividends, even during times of macroeconomic stress, highlights its robust cash flow and long-term business resilience, making it particularly appealing to income-oriented investors.

That said, investors should consider UnitedHealth’s dividend yield, which typically ranges between 1% and 1.5%. While the company continues to raise its dividend annually, its relatively low yield reflects a high stock price and a strategy centered on long-term expansion. Substantial capital is still being directed toward strategic acquisitions, digital health initiatives, and expanding healthcare services through its fast-growing Optum segment. These growth priorities may moderate the pace of future dividend hikes, particularly if rising healthcare costs, regulatory scrutiny, or margin pressures begin to affect earnings growth. Nonetheless, UnitedHealth’s strong track record suggests it is well-positioned to continue delivering growing dividend payouts over the long term.

Insider Trading

In late 2023 and early 2024, several UnitedHealth Group executives, including then-CEO Andrew Witty and CFO John Rex, sold large amounts of stock, much of it through pre-planned 10b5-1 programs. However, the timing raised concerns, as these sales occurred shortly before news broke of a Department of Justice antitrust investigation. The sales triggered political and regulatory scrutiny, with lawmakers requesting an SEC investigation. This pattern raised red flags around governance, timing, and transparency.

In contrast, 2025 saw a sharp reversal. After UnitedHealth’s stock plunged nearly 50%, a wave of insider buying signaled renewed confidence. CEO Stephen Hemsley purchased $25 million worth of stock, joined by the CFO and several board members in a coordinated buying spree exceeding $30 million. These open-market purchases, some of the largest in company history, send a strong green signal, suggesting insiders see long-term value and are committed to the company’s recovery.

Other Company Info

Founded in 1977, UnitedHealth Group is one of the world’s largest and most influential healthcare companies, known for its integrated approach to health benefits and services. As of 2025, UnitedHealth employs over 400,000 people globally through its two main business segments: UnitedHealthcare (health insurance) and Optum (health services, data, and technology). The company is publicly traded on the New York Stock Exchange under the ticker symbol UNH and operates within the Health Care sector, specifically in the Managed Health Care industry.

UnitedHealth Group is headquartered at 9900 Bren Road East, Minnetonka, Minnesota, USA. As of 2025, the company has approximately 920 million shares outstanding, with a market capitalization exceeding $400 billion USD. For more information, visit UnitedHealth Group’s official website: https://www.unitedhealthgroup.com.

Illustration 27-28: Number of employees and location of UnitedHealth Group

Final Verdict

UnitedHealth Group stands out as a strong long-term investment, particularly for growth and income-oriented investors. While its debt and liabilities has grown and its cash on hand is on the lower side, the company’s consistent earnings growth, strong cash flow, and dominant position in the healthcare sector can make it a good play. Its steadily rising dividend, conservative payout ratio, and robust balance sheet make it a reliable income-generating stock. In addition, it’s fallen P/E ratio and P/B ratio for 2025 can make it seem undervalued.

The company’s dual-engine model, combining UnitedHealthcare’s insurance business with Optum’s data-driven health services, provides diversification and resilience. UnitedHealth continues to invest heavily in technology, analytics, and value-based care models, positioning itself at the forefront of healthcare transformation.

Overall, UnitedHealth Group remains an attractive option for long-term investors seeking a mix of stability, innovation, and steady returns. Its strong fundamentals, leadership in a defensive sector, and long track record of performance make it a compelling addition to a diversified portfolio. It could potentially be a very good option for investors looking for undervalued companies after the stock has fallen by 50% in 2025.

Compound Interest: The Magic Formula Behind Investing that turn time into wealth

Let’s begin with a riddle that has baffled more than a few bright minds. Suppose I offer you a choice: either I hand you $1 million right now, or I give you a single penny today that doubles in value every day for 30 days. Which would you take?

24,100+ Us Dollar Drawing Stock Photos, Pictures & Royalty-Free Images -  iStock

Illustration 1: 100 USD, the highest USD note

Most people instinctively jump at the million-dollar offer. A million bucks in hand feels like a dream come true. That’s life-changing money, after all. But if you run the math on that humble penny, something astounding happens. On day five, it’s just 16 cents. On day ten, it’s still under $6. But by day twenty, it explodes past $5,000. And on day thirty? That penny is worth over ten million dollars.

That, in a nutshell, is the sheer power of compounding, the secret sauce behind many of the world’s wealthiest investors. And yet, it remains one of the most misunderstood, underestimated, and underused concepts in personal finance and trading alike. While others chase quick profits and high-risk trades, the smartest players in the game let time do the heavy lifting.

Compound investing is the financial equivalent of planting an apple tree and waiting patiently until you’re sitting in an orchard. At its heart, compounding means that your investments don’t just earn returns, they also earn returns on those returns. It’s a cycle of reinvestment, where growth builds upon growth, snowballing over time into something far greater than you started with.

Imagine putting $1,000 into an investment that earns 10% per year. After one year, you have $1,100. If you leave that full amount invested, the next 10% applies not just to your original $1,000, but to the $1,100 total which gives you $1,210. Then it grows to $1,331, then $1,464, and so on. Eventually, what started as a small seed becomes a forest of wealth.

How to Draw a Summer Vacation - Really Easy Drawing Tutorial

Illustration 2: You don’t need to do anything, you can be on hammock in Indonesia and just relax if you want to


And the best part? You don’t have to do anything fancy. You don’t need a degree in finance or a crystal ball to time the market. You just need the discipline to start, the patience to wait, and the wisdom to let compounding do its thing.

Let’s be blunt: most people want to get rich fast. We are hardwired to crave instant results. That’s why trading apps, meme stocks, and crypto roller coasters are so addictive. They feed the dopamine circuits in our brains. But in the long run, these fast strategies tend to burn more than they build.

We put AMC, GameStop and other meme stocks' numbers to the test — here's  which ones came out on top - MarketWatch

Illustration 3: A lot of people such as those at the r/wallstreetbets subreddit focus on getting rich quick.

Compound investing, by contrast, doesn’t try to outsmart the market on a daily basis. It bets on consistency, not cleverness. Over long periods, compounding will often outperform flashy trading simply because it never stops working. Your capital keeps growing while you sleep, while you’re on vacation, while you’re living life. You don’t have to hustle, your money does it for you.

The real beauty of compound investing is that its effect accelerates over time. The longer you leave your investment untouched, the more explosive its growth becomes. This is why starting early is often more powerful than starting big.

The numbers behind compounding are not just impressive, they’re mind-blowing. Let’s take a simple scenario: you invest $10,000 at an 8% annual return, compounded once a year. In 30 years, that $10,000 becomes over $100,000. You didn’t lift a finger, yet your money grew tenfold.

Now, add a monthly contribution of just $300. That same investment explodes to nearly half a million dollars over the same timeframe. The math is straightforward, but the implications are profound. With time and consistency, even modest investments can turn into serious wealth.

Wolf of Wall Street illustration #1 - Jordan Belfort Leonardo Dicaprio  Money Pop Art Print Home Decor Poster Print (11x17 inches) : Amazon.com.au:  Home

Illustration 4: Over time compound interest can lead to serious wealth

There’s even a trick to estimate how long it takes for your investment to double: the Rule of 72. Just divide 72 by your annual return rate. At 8%, your money doubles in 9 years. That’s two doublings in 18 years, four in 36. It sneaks up on you, and suddenly, you’re looking at a portfolio that dwarfs what you ever imagined possible.


Trading is sexy. It makes for great movies, exciting YouTube channels, and nail-biting nights staring at candlestick charts. But here’s the dirty little secret: most traders lose money. Not just some — most.

Marine trip of friends, wealthy or rich people enjoying summer vacations  cruising on yacht. personage jumping in water and sunbathing on boat or  luxurious ship. swimming vector in flat style | Premium

Illustration 5: Trading will eat up most of your capital that you could have used to become wealthy

The reasons are many. Transaction fees eat into profits. Emotions lead to poor decisions. Taxes hammer short-term gains. And worst of all, one bad trade can erase dozens of good ones. Trading rewards sharpness, but penalizes mistakes with brutal efficiency.

Compound investing plays a different game entirely. It’s slow, steady, and boring , in the best possible way. It rewards discipline, not luck. It minimizes fees, avoids taxes through long-term holding, and removes emotional triggers. While traders swing for the fences, compound investors jog steadily around the bases. And nine times out of ten, it’s the jogger who wins.

Illustration 6: An illustration showing the power of compound interest

Even in the trading world, the best players understand the power of compounding. They don’t gamble on every tick. They develop strategies that can grow capital sustainably. They think in terms of systems and longevity. In short, they let their skills and their capital compound over time.

If compounding is the vehicle, time is the fuel. Nothing supercharges compound investing like giving it time to work. And the earlier you start, the more time you have, the bigger your outcome.

There’s a famous story in finance circles about two hypothetical investors. One starts investing $200 a month at age 22 and stops at 30. The other waits until 30 and invests $200 monthly until retirement at 65. Guess who ends up with more money?


Illustration 7: Time is the fuel that powers it all

Surprisingly, the early starter wins, even though she contributed far less overall. That’s the power of compounding in action. The early years are the most valuable, because they multiply over the longest time. The longer your money compounds, the less you have to contribute later. The system does the heavy lifting.

Now, what if you’re reading this at 35, 40, or even 50 and feeling regret bubble up? Here’s the good news: it’s never too late to harness compounding. Yes, you’ll need to save more aggressively, and you may not have quite as much time. But compound investing still works.

Leonardo Dicaprio Cheers Blank Meme Template - Imgflip

Illustration 8: There is never to late to start compounding which is cause for celebtation

You can boost the effects by increasing contributions, reducing fees, reinvesting dividends, and choosing slightly higher-yielding (but still prudent) investments. The most important thing is to begin, not perfectly, but immediately.

Warren Buffett, arguably the greatest investor of all time, built 99% of his wealth after the age of 50. He began investing at age 11 and never stopped. His wealth isn’t due to extraordinary returns, it’s due to extraordinary time. His investing returns have been great, sure — but it’s the decades of compounding that turned great into godlike.

Warren Buffett Painting by MotionAge Designs - Pixels

Illustration 9; Legendary Investor Warren Buffet is someone that have built his wealth on compounding

Then there’s Ronald Read, a Vermont janitor who quietly amassed over $8 million through steady investing and compounding. Or Anne Scheiber, a retired IRS agent who left behind $22 million after years of investing modestly in dividend stocks. These weren’t hedge fund managers. They were regular people who simply understood compounding and never gave up on it.


You don’t need a Wall Street advisor or a six-figure salary to begin. Open a brokerage account or a retirement fund. Automate monthly contributions, even if they’re small. Choose index funds or dividend-paying stocks with a history of stability and growth. Reinvest every dollar you earn. Then walk away. Let it grow.

Wall Street Banker Print No Frame / Small

Illustration 10: You don’t need to be a Wall Street investor to benefit from compound investing, a normal index fund like VOO or SPY will do.

The hardest part is resisting the temptation to tinker. When markets dip, and they will, don’t panic. Compounding doesn’t care about temporary downturns. It thrives over the long haul. The more hands-off you are, the better it works.

There are a few landmines that destroy compounding’s magic. The biggest is pulling out money too early. Every time you interrupt compounding, you reset the process. Another killer is chasing hot trends and high-risk stocks that can wipe out gains. High fees are another silent thief, quietly siphoning away your future wealth. And perhaps worst of all is waiting too long to start.

It’s easy to dismiss compound investing as “too slow” or “too dull.” But those who stick with it know the truth: it’s anything but boring. Watching your money grow, slowly at first, then exponentially, is one of the most thrilling experiences in finance. It feels like cheating — only it’s not.

Compound investing is the rare strategy that doesn’t just build wealth. It builds freedom. It buys you time, security, and peace of mind. It works when you sleep. It grows when you’re busy living. It’s not a sprint — it’s a quiet revolution, unfolding silently in the background.

In the fable of the tortoise and the hare, it’s the slow, steady, unshakable turtle who wins the race. Compound investing is your turtle. It doesn’t promise instant riches. It doesn’t thrill with daily highs. But over time, it builds something far more valuable: lasting wealth.

Di00061 Turtle Rabbit race – Frits Ahlefeldt – My Art and Stories

Illustration 11: Be the turtle not the rabbit


In the fable of the tortoise and the hare, it’s the slow, steady, unshakable turtle who wins the race. Compound investing is your turtle. It doesn’t promise instant riches. It doesn’t thrill with daily highs. But over time, it builds something far more valuable: lasting wealth.

So stop chasing hot tips. Ignore the noise. Start investing, early if you can, consistently no matter what, and with patience above all. Let your money work harder than you ever could. Let compounding carry you toward the life you dream of.

Because once you understand compound investing, you’ll realize something extraordinary: you don’t have to get rich quick… when you can get rich for sure.

A Stock Analysis of Boeing Company: Navigating Headwinds and Opportunities

Introduction

The Boeing Company is one of the world’s largest aerospace and defense corporations, renowned for its cutting-edge innovations in commercial aviation, space exploration, and military systems. Headquartered in Arlington, Virginia, Boeing plays a pivotal role in global mobility and national defense, supplying aircraft, satellites, and defense systems to customers across more than 150 countries.

Illustration1 : The Boeing logo, a global symbol of aviation excellence and aerospace innovation.

Boeing operates across several major sectors including commercial airplanes, defense, space, and security systems, as well as global services. It is best known for its iconic aircraft such as the 737, 777, and 787 Dreamliner, which have helped connect the world’s cities and economies. Beyond aviation, Boeing leads ambitious projects in space travel, advanced robotics, and autonomous flight technologies.

Unlike many traditional manufacturing companies, Boeing evolved from the pioneering age of aviation and has remained a dominant force throughout the 20th and 21st centuries. Its legacy of innovation, high-performance engineering, and large-scale systems integration makes it a cornerstone of the global aerospace and defense industry.

History

Boeing was founded in 1916 by aviation pioneer William E. Boeing in Seattle, Washington. Originally a small manufacturer of seaplanes, the company played a significant role in both World Wars, supplying military aircraft that proved decisive in combat. Post-World War II, Boeing helped usher in the Jet Age with the launch of the 707, the first successful commercial jetliner.

Illustration 2: Boeing 707, was the first successful commercial jetliner.

Boeing’s commercial success soared with aircraft like the 737, 747, and 777, revolutionizing long-distance air travel. The 747, in particular, became a global icon and the world’s first wide-body “jumbo jet,” transforming air travel in the 1970s.

In 1997, Boeing merged with McDonnell Douglas, strengthening its position in the defense sector. The company also expanded into space systems, becoming a key contractor for NASA, including work on the International Space Station, Space Launch System, and Starliner crew capsule.

Despite facing challenges such as the 737 MAX crisis, global supply chain issues, and geopolitical headwinds, Boeing continues to be a vital force in aerospace innovation and global defense capabilities.


Operations and Production

  • Portfolio

Boeing is one of the world’s leading aerospace companies, with core operations centered around the design, manufacture, and support of commercial airplanes, defense systems, satellites, and space exploration technologies.

Its flagship commercial aircraft include the 737, 747, 767, 777, and 787 Dreamliner families. With operations in over 65 countries and customers in more than 150, Boeing is one of the largest exporters in the United States.

Its operations are divided into three primary business units:

Illustration 3: A Boeing commercial plane landing.

Boeing Commercial Airplanes (BCA), which designs, assembles, and delivers aircraft to airlines and leasing companies. Boeing’s commercial aircraft families include 737 (The best-selling jetliner in history, primarily used for short- to medium-haul routes) and 787 Dreamliner (A long-haul, fuel-efficient wide-body aircraft made with composite materials).

Furthermore, it includes 777 and 777x ( Known for long-range and high-capacity, with the 777X featuring folding wingtips and the world’s most powerful jet engines), and 767 and 747-8 (used for both passenger and cargo operations, with the 747 being the iconic “Queen of the Skies).

Boeing Defense, Space & Security | Military Wiki | Fandom

Illustration 4: A Boeing Spy plane

The second division of Boeing is Boeing Defense, Space & Security (BDS) which delivers products and services to government customers worldwide. This includes: Combat aircraft such as the F/A-18 Super Hornet and F-15EX Eagle II. Furthermore it also includes Rotary-wing platforms like the AH-64 Apache and CH-47 Chinook helicopters.

Missile defense systems, satellites, and space launch systems including the Space Launch System (SLS), the most powerful rocket NASA has ever built, is also part of the BDS division of Boeing.

The third division is Boeing Global Services (BGS) which offers logistics, maintenance, training, parts, and digital aviation services. BGS supports both commercial and defense customers with end-to-end lifecycle services


Boeing Stock Is Not A High-Flyer, But Its Recovery Could Pay Off | Seeking  Alpha

Illustration 5: Boeing revenue by segment

As can be seen from illustration 4, the largest segment for Boeing is commercial Airplanes at 43%. However, Defense, Space & Security also makes up a very big segment at 32% and Global Services at 25 %.

Boeing’s global manufacturing network includes major facilities in the U.S. (notably Everett and Renton, Washington; Charleston, South Carolina; and St. Louis, Missouri), along with significant operations in Australia, the U.K., Canada, and the Middle East.

  • Technology and Space

Boeing plays a key role in space exploration and defense innovation. Through its work with NASA, Boeing helped develop the International Space Station (ISS) and is now working on the Starliner spacecraft, designed to transport astronauts to low Earth orbit.

In defense, Boeing is investing in autonomous systems such as the MQ-25 Stingray (an unmanned aerial refueling aircraft), loyal wingman drones, and space-based missile defense technologies. Boeing is also a key player in hypersonic weapons development and satellite constellations for secure communications and Earth observation


In the AI and digital space, Boeing uses advanced analytics, machine learning, and digital twins to optimize manufacturing, maintenance, and flight operations. he company’s “AnalytX” suite supports real-time fleet health monitoring, and its digital solutions are integrated into flight operations globally.

Boeing MQ-28 Ghost Bat - Wikipedia

Illustration 6: Loyal Wingman, an AI-enabled drone developed in Australia, designed to operate alongside manned fighter jets.

Key Competitors

Boeing competes across various aerospace and defense sectors. Its competitors differ depending on whether the focus is on commercial aviation, defense contracts, or space exploration.

1. Commercial Aviation

Airbus SE is Boeing’s primary global competitor in commercial aircraft. Airbus’s A220, A320neo, and A350 families compete head-to-head with Boeing’s 737 MAX, 787, and 777 series.

COMAC is backed by the Chinese government, COMAC aims to reduce reliance on Western aircraft through its C919 and ARJ21 models.

Embraer is a leading manufacturer of regional jets, Embraer was once part of a failed merger with Boeing but remains a strong player in the 70–150 seat market.


2. Defense and Military Systems

Lockheed Martin, dominates in fighter aircraft and space systems with platforms like the F-35 and Orion.

Northrop Grumman is a competitor in autonomous aircraft, strategic bombers (B-21 Raider), and satellite systems.

Raytheon Technologies, provides engines (via Pratt & Whitney), avionics, and missile systems used in both commercial and military platforms.

3. Space and Emerging Tecg

SpaceX, Elon Musk’s company is a disruptive force in spaceflight, reusable rockets, and low Earth orbit (LEO) satellite networks (Starlink).

Blue Origin is competing with Boeing for lunar landers and suborbital space tourism.

Palantir, Anduril is tech firms, entering defense with AI-powered battlefield intelligence and surveillance systems.

Competitive Advantage

Boeing’s competitive advantage is rooted in its scale, technical expertise, and diverse operations across commercial aviation, defense, and space.

As one of the oldest and most recognized names in aerospace, Boeing benefits from a strong brand reputation built on decades of delivering reliable, high-performance aircraft and systems. This reputation fosters long-term trust and loyalty among airlines, governments, and space agencies worldwide.

Boeing secures 777 order from Lufthansa Cargo and Swiss - Puget Sound  Business Journal

Illustration 7: A Boeing Aircraft flying over the Alps

The company’s vertically integrated operations and vast global supply chain give it the ability to manufacture complex systems at scale, while also adapting to local markets and geopolitical shifts. Boeing’s Global Services division adds further value by offering lifecycle support, digital solutions, and predictive maintenance, deepening customer relationships beyond the point of sale.

Boeing’s broad product portfolio, from narrow-body jets and wide-body aircraft to fighter jets, satellites, and launch vehicles, allows it to spread risk and capture opportunities in multiple markets. During commercial downturns, its defense and space segments provide financial stability and continuity.


Innovation is another core strength. Boeing continuously invests in advanced manufacturing, autonomous systems, artificial intelligence, and sustainable technologies. Programs like the ecoDemonstrator test platform and partnerships in urban air mobility demonstrate its commitment to shaping the future of flight.

Boeing Sees Big Airline Fleet Growth From Middle East | Aviation  International News

Illustration 8: A Boeing 777

Combined with its global presence and government partnerships, Boeing’s ability to integrate technology, scale, and service gives it a clear edge in a highly competitive industry.

Future Outlook

Boeing is entering a new growth phase as the aviation industry rebounds and global demand for commercial aircraft returns. The company is ramping up production of its 737 MAX and 787 models, while its defense and space divisions continue to secure major contracts, especially in the U.S. and Asia-Pacific.

Sustainability is at the core of Boeing’s future strategy, with investments in sustainable aviation fuels, electric and hydrogen propulsion, and next-generation aircraft. Its space ventures, including the Starliner and Space Launch System, position Boeing to play a major role in future space exploration. With a strong order backlog and focus on innovation, Boeing is well placed to lead the aerospace industry into the next era.


Stock Analysis

In this section we will analyze Toyota’s stock to see if it is a good stock to buy or not. Our philosophy is value investing meaning that we try to find good quality companies that are undervalued. However, we will give a holistic overview so all kind of investors with different philosophies can judge the stock for themselves.

Revenue and Profits

Illustration 9 and 10: Revenue of Boeing from 2009 to 2024

As shown in Illustrations 9 and 10, Boeing’s revenue trajectory has had sharp fluctuations rather than steady growth, with a particularly severe decline between 2018 and 2020. After peaking at around USD 101 billion in 2018, revenues plunged to approximately USD 58 billion by 2020, a staggering drop of over 40% in just two years. This steep decline, triggered by the grounding of the 737 MAX and compounded by the COVID-19 pandemic’s impact on global air travel, raising red flags for investors about Boeing’s operational resilience and crisis management.

While Boeing has made progress in recovering since then, revenues have not yet returned to pre-2018 levels as of 2024. The pace of recovery has been gradual, reflecting ongoing efforts to stabilize production, resolve supply chain issues, and rebuild customer confidence. Boeing’s focus on both commercial and defense segments provides some diversification, but its performance remains sensitive to the global aerospace market and regulatory developments.

Overall, Boeing’s financial performance over the past several years reflects a company navigating a complex recovery phase. The revenue volatility underscores the challenges faced during a turbulent period, but also highlights the potential for future growth as commercial aviation rebounds and new aircraft programs come online. For investors, this mixed picture calls for careful monitoring rather than a clear red or green flag.

Illustration 11 and 12: Net Income of Boeing from 2009 to 2024

Net income is a crucial metric to evaluate when determining whether a company is a worthwhile investment. It represents a company’s net profit or loss after accounting for all revenues, income items, and expenses, calculated as Net Income = Revenue – Expenses.

As seen in Illustrations 10 and 11, Boeing’s net income has shown significant volatility, with a sharp decline into negative territory from 2018 to 2020. This drop, driven by the 737 MAX crisis and the pandemic’s impact on air travel, marks a clear red flag, as profits fell even more steeply than revenues.

Although Boeing has made efforts to recover, net income remains inconsistent, reflecting ongoing challenges in production, regulation, and market demand. Unlike companies with steady profit growth, Boeing’s recent earnings instability signals elevated risk for investors focused on financial reliability.

Revenue Breakdown

Is Boeing Co (BA) Fairly Valued? A Comprehensive Analysis

Illustration 13: Revenue breakdown of Boeing Co,

As shown in Illustration 13, Boeing’s core Commercial Airplanes segment remains its largest revenue contributor, typically accounting for around 40% of total revenue. This includes sales of aircraft such as the 737, 787, and 777 models to global airline customers and leasing firms. While historically a strong growth engine, this segment has experienced significant disruption since 2019 due to the 737 MAX grounding, COVID-19, and ongoing supply chain issues, resulting in elevated costs and production delays.

The Defense, Space & Security division, contributing around 35% of revenue, provides more consistent performance through multi-year government contracts for military aircraft, satellites, and surveillance systems. Boeing Global Services, making up roughly 26% of revenue, generates recurring income from maintenance, spare parts, pilot training, and digital analytics—supporting airline customers through fleet lifecycle services.

Boeing’s main costs that eats up most of it’s revenue is cost of goods sold (COGS) which remains very high, typically representing around 94.7% of revenue, reflecting the capital-intensive nature of aircraft production and frequent cost overruns related to rework and supply constraints. SG&A expenses covers global operations, customer support, and corporate functions while R&D expenses focuses on fuel efficiency, autonomous systems, digital engineering, and sustainable aviation, though these initiatives are still early in commercial impact. Emerging technologies such as space-based systems, electric propulsion, and advanced air mobility are strategically important but currently represent a small share of revenue. These areas are gradually expanding through joint ventures and government partnerships.

Overall, Boeing’s revenue structure reflects both high operating complexity and long-term diversification. While its defense and services businesses offer some financial stability, elevated costs and pressures in the commercial segment pose near-term challenges. The company’s ongoing investment in innovation underscores its long-term vision, but achieving margin recovery will depend on execution, supply chain normalization, and restoring commercial delivery volumes.

Earnings per Share

Illustration 14: Earnings per share for Boeing from 2009 to 2024

Earnings Per Share (EPS) is a key financial metric that measures a company’s profitability on a per-share basis. It indicates how much profit a company generates for each outstanding share of its stock, and is used to assess a company’s financial health, profitability, and potential for growth. In other words this metric can tell us how profitable the business is.

The EPS figure itself isn’t the primary focus for value investors, it can be 0.2 or 10, but what truly matters is the company’s ability to generate consistent earnings growth. A steadily increasing EPS over time signals strong financial health, profitability, and long-term value creation.

Boeing’s earnings per share from 2009 to 2025 shows a sharp decline from 17.85 in 2018 to -20.88 in 2020, marking a significant red flag. This drop was driven by the 737 MAX grounding and the pandemic’s impact on global aviation. While EPS has recovered somewhat in recent years, it remains below pre-crisis levels, reflecting continued cost pressures, supply chain issues, and production delays. The volatility in earnings highlights Boeing’s financial vulnerability during industry shocks and signals ongoing risk. For investors, this uneven trend raises concerns about near-term stability despite the company’s long-term strategic efforts. Furthermore, it had another significant drop from 2023 to 2024. These developments should be closely monitored by potential investors and are clear red flags.

Assets and Liabilities

Illustration 15 and 16: Assets and Liabilities for Boeing from 2009 to 2024

When evaluating a company as a potential investment, understanding its assets and liabilities is crucial. If a local business owner offered to sell their shop to you, one of the first questions. after determining its profitability, would be about its equity and assets. The same principle applies when assessing publicly traded companies like Boeing.

As shown in Illustrations 14 and 15, Boeing’s total assets reached approximately $156 billion in 2024, a figure that reflects the scale of its global operations. However, unlike the steady asset growth seen in some peers, Boeing’s asset base has fluctuated over the past decade due to write-downs, delivery delays, and program-related adjustments. While recent investments in next-generation aircraft and digital systems signal a forward-looking strategy, overall asset growth has been modest and uneven.

At the same time, Boeing’s total liabilities have increased substantially, rising to over $160 billion in 2024. Much of this is tied to debt issued during the pandemic to maintain liquidity and stabilize operations. While some leverage is expected in capital-intensive industries, Boeing’s high debt load combined with continued cash flow pressures raises concerns and big red flags about long-term financial flexibility and resilience. Investors should closely monitor Boeing’s ability to reduce debt and restore balance sheet strength in the coming years.

The critical issue for investors is whether Boeing can return to sustained profitability while managing its obligations. With thin margins and ongoing production costs, the company faces the challenge of generating sufficient free cash flow to reduce its liabilities without sacrificing investment in innovation and quality control. Failure to improve operating efficiency or deliver aircraft at scale could intensify financial strain.

Boeing’s cash on hand in 2024 remains relatively low compared to its long-term debt, which presents a red flag for liquidity. This imbalance could make it more difficult to weather unexpected disruptions or fund strategic initiatives without additional borrowing or asset sales. Investors should keep a close watch on Boeing’s cash generation and working capital management to assess its ability to support operations and repay obligations in the near term.

As seen in Illustration 15, Boeing’s total shareholder equity has turned negative in recent years, meaning its liabilities exceed its assets. This trend is a serious concern, as it indicates erosion of the company’s financial foundation and limited cushion against further losses. Negative equity can restrict financial flexibility and undermine investor confidence, especially if cash flow does not improve. While Boeing retains strong long-term potential in aerospace and defense, rebuilding equity will be essential to restoring investor trust and ensuring long-term financial stability.

Debt to Equity Ratio

Illustration 17 and 18: Debt to Equity ratio for Boeing from 2009 to 2024

The Debt-to-Equity (D/E) ratio is an important financial metric for assessing a company’s financial leverage and risk. It compares the amount of debt a company uses to finance its operations relative to its shareholder equity. A high D/E ratio suggests the company relies more heavily on debt, increasing financial risk, especially during periods of economic stress. In contrast, a lower D/E ratio implies more conservative financing through equity, offering greater financial stability but possibly slower expansion.

Legendary value investor Warren Buffett generally prefers a D/E ratio below 0.5. However, Boeing’s total shareholder equity turned negative in recent years, meaning its liabilities now exceed its assets. As a result, the D/E ratio is no longer a meaningful metric in the traditional sense, it is effectively undefined or extremely high. This situation signals a red flag, as it reflects the long-term financial strain caused by the 737 MAX crisis, pandemic-era losses, and the need for heavy borrowing to sustain operations. Restoring equity and reducing debt will be critical to improving financial health. Until then, the absence of a meaningful D/E ratio highlights the company’s reliance on debt financing and underscores the importance of disciplined cash flow management and margin recovery in the years ahead.

Price to earning ratio (P/E)

Illustration 19 and 20: Price to Earnings ratio for Boeing from 2009 to 2024

For value investors, one of the most critical metrics when evaluating Boeing’s stock is the price-to-earnings (P/E) ratio, as it helps assess whether the company is undervalued or overvalued. Even if a company has a strong brand and global footprint, paying too much for its stock can still result in poor returns. For example, imagine a business that earns $1 million annually, if offered to you for $1, it’s a steal. But if the owner asks $1 trillion, the profitability becomes irrelevant, the price is simply too high. The stock market works the same way: even good companies can be bad investments if bought at inflated prices.

Warren Buffett, a legendary value investor, generally prefers companies with a P/E ratio below 15, viewing them as attractively priced relative to earnings. In Boeing’s case, the situation is more complex. Due to multi-year losses from 2019 to 2021, Boeing’s P/E ratio has either been undefined or exceptionally high during those periods. As earnings have begun to recover, the P/E ratio remains volatile, sensitive to quarterly swings and investor sentiment. As of 2024, Boeing trades at a forward P/E ratio above 40, reflecting high expectations for recovery rather than current earnings strength.

For value investors, this elevated P/E signals caution. While Boeing’s long-term aerospace and defense prospects remain strong, the current valuation suggests that much of the recovery optimism is already priced in. Unless earnings normalize quickly and sustainably, the stock may offer limited margin of safety at current levels.

Price to Book ratio (P/B)

Illustration 21 and 22: Price to book ratio for Boeing from 2009 to 2024

Price-to-book value (P/B ratio) compares a company’s market value to its book value, calculated as total assets minus total liabilities. A low P/B ratio may indicate undervaluation, while a high ratio can signal overvaluation or strong growth expectations. Value investors, including Warren Buffett, often prefer P/B ratios under 1.5, ideally closer to 1.3, when seeking companies trading below their intrinsic asset value.

For Boeing, however, the P/B ratio is no longer meaningful, as the company’s shareholder equity has turned negative in recent years due to accumulated losses and rising liabilities. This means the book value per share is also negative, making the traditional P/B metric undefined.

Rather than suggesting undervaluation, this situation is a red flag, highlighting the weakened state of Boeing’s balance sheet. While Boeing continues to hold strategic value in commercial and defense aerospace, value investors are likely to remain cautious until equity becomes positive again and financial fundamentals stabilize.

Return on Investment (ROI)

Illustration 23 and 24: Return on Investment for Boeing from 2009 to 2024

For value investors, another essential metric when evaluating Boeing’s stock is Return on Investment (ROI), as it shows how efficiently the company uses its capital to generate profits. In simple terms, ROI measures the return earned relative to the capital required to operate the business. A company may have strong revenue, but if it requires heavy capital to generate modest profits, it may not be an efficient investment. For example, if two firms earn the same profit, but one uses half the capital to do so, it’s clearly more efficient. ROI helps investors identify companies that convert capital into returns effectively—a key consideration in capital-intensive industries like aerospace.

Boeing’s ROI has been highly volatile in recent years, and negative during 2017. While ROI has improved as earnings begin to recover, it still lags behind industry expectations. Boeing’s returns have been erratic, raising questions about capital efficiency and long-term value creation. As shown in Illustration 23 and 24, this inconsistent performance reflects the ongoing challenges Boeing faces in restoring operational stability, managing debt, and navigating cost overruns. For long-term investors, this is a cautionary signal, as it suggests that the company has yet to regain full control over its capital deployment. While Boeing remains a leader in aerospace innovation, meaningful improvement in ROI will be key to signaling that the company is delivering sustainable value from its significant investments. A 13% ROI for Boeing in 2024 is a good sign, especially considering its turbulent past few years. It suggests Boeing is becoming more efficient with its capital again. However, it should be assessed alongside other metrics, like cash flow, equity, debt levels, and order backlog, to judge whether the improvement is sustainable and investable.

Dividend

Illustration 25:  Dividend Yield and dividend payout ratio from 2005 to 2025 for Boeing

Boeing has historically been a reliable dividend payer, with its annual dividend reaching as high as $2.06 per share in early 2020 and an average dividend yield around 2.5% over the past five years. However, Boeing suspended dividend payments in March 2020 amid financial challenges from the 737 MAX crisis and the COVID-19 pandemic. Since then, no dividends have been issued.

In 2024, Boeing reported a negative earnings per share (EPS) of approximately -$18.36, and while its dividend payout ratio would have been around 48% based on prior earnings patterns, the suspension means the actual payout ratio is effectively zero. This pause in dividends is a red flag for income-focused investors who value steady cash returns. That it has suspended dividends is a big red flag for investors.

Insider Trading

Illustration 26: Recent insider trading at yahoo, gathered from yahoo finance

Recent insider trading activity at Boeing has shown a significant increase in insider selling, which may raise concerns for investors. Between early and mid-May 2025, multiple senior executives, including Boeing’s Executive Vice Presidents and Presidents of major divisions sold substantial amounts of company stock, collectively worth several million dollars. While insider selling can be part of routine financial planning or diversification, the concentrated timing and volume of these sales are noteworthy.

Insider selling at this level can be interpreted as a potential red flag, as it may suggest that insiders have less confidence in the company’s near-term prospects or are taking advantage of current stock prices before possible declines. For value investors, such activity warrants closer scrutiny and signals the importance of monitoring Boeing’s forthcoming earnings results, operational updates, and market conditions.

Other Company Info

Founded in 1916, The Boeing Company is one of the world’s largest and most respected aerospace manufacturers, known for its commercial aircraft, defense systems, and space technologies. As of 2024, Boeing employs approximately 140,000 people globally, reflecting its extensive operations in manufacturing, engineering, research, and services. The company is publicly traded on the New York Stock Exchange (NYSE) under the ticker symbol BA and operates within the Industrials sector, specifically in the Aerospace & Defense industry.

Boeing is headquartered at 100 North Riverside Plaza, Chicago, Illinois, USA. As of 2024, the company has approximately 560 million shares outstanding, with a market capitalization of around $140 billion USD. For more information, visit Boeing’s official website: https://www.boeing.com.

Illustration 17: Number of employees and location of Boeing.

Final Verdict

The Boeing Company currently faces significant challenges that make it a risky investment, especially for value and income investors seeking stability. Despite being a major player in aerospace, Boeing’s financials reveal several red flags: the company has negative shareholder equity, high debt levels, and low cash reserves, which limit its financial flexibility and increase risk during downturns.

Boeing’s earnings have been volatile, and recent dividend cuts have diminished its appeal to income-focused investors. Ongoing production issues, delays, and market uncertainties further cloud the company’s near-term prospects. While Boeing is investing in innovation and defense contracts, these efforts have yet to translate into consistent profitability or a stronger balance sheet.

Overall, Boeing’s current financial health and operational risks suggest caution. It may not be suitable for conservative investors, and those considering it should be prepared for potential volatility and a prolonged recovery period. This makes Boeing a less attractive choice compared to more stable industry peers.

Toyota Motor Corp. – A Stock Analysis of one of the leading automakers of the world

Introduction

Toyota Motor Corporation is a globally renowned Japanese multinational automotive manufacturer, widely regarded as one of the world’s leading innovators in mobility, automotive engineering, and sustainable transportation.

The Toyota logo has an ingenious hidden message | Creative Bloq

Illustration 1: he Toyota logo, a symbol of trust, innovation, and global mobility.

Headquartered in Toyota City, Japan, the company is best known for its high-quality vehicles and pioneering work in hybrid technology, but its operations span a broad spectrum including robotics, AI, autonomous driving, and hydrogen fuel cell systems.

Unlike many Western automakers that evolved in tandem with the American and European car industries, Toyota carved a unique path grounded in the principles of Kaizen (continuous improvement) and Just-In-Time manufacturing, revolutionizing global automotive production with the Toyota Production System (TPS). Its reputation for reliability, efficiency, and innovation has made it a household name in markets around the world.

Toyota is consistently ranked among the top global automakers by volume and market capitalization. It has spearheaded the automotive industry’s shift toward sustainability through its leadership in hybrid technology (beginning with the Prius) and its bold push into hydrogen-powered and battery electric vehicles. With a growing focus on AI, connected vehicles, and mobility-as-a-service, Toyota continues to shape the future of transportation.

History

Toyota was founded in 1937 by Kiichiro Toyoda, evolving from Toyoda Automatic Loom Works. Initially focused on producing passenger cars for the Japanese market, the company quickly established itself with models like the Toyota AA and developed a reputation for durable vehicles in the post-war period.

How Toyota's first car vanished, re-emerging years later in Russia

Illustration 2: The first Toyota passenger car was the Toyoda Model AA

The real global breakthrough came during the 1970s and 1980s, when Toyota expanded aggressively into North America and Europe. Its compact, fuel-efficient cars, such as the Corolla and Camry, gained popularity during the oil crisis, helping it gain a foothold in key international markets.


Toyota became a global icon of manufacturing excellence with the development of the Toyota Production System (TPS) which is a manufacturing philosophy that transformed supply chains worldwide. In 1997, it launched the Prius, the world’s first mass-produced hybrid electric vehicle, cementing Toyota’s role as an environmental pioneer in the auto industry.

In the 2010s, Toyota expanded into next-generation mobility, investing in AI research, autonomous driving (under its subsidiary Woven by Toyota), and alternative energy sources such as hydrogen fuel cells (Mirai). The company has continued to build its brand as not just an automaker but a mobility solutions provider.

Today, Toyota operates over 50 manufacturing facilities worldwide and sells vehicles in more than 170 countries. It remains the world’s largest automaker by units sold, combining innovation with a deep commitment to quality and sustainability. Its reputation is that their cars will last for ever due to their quality.

Operations and Production

  • Portfolio

Toyota is a car company and it’s core operations center around the development, manufacturing, and sale of automobiles, including sedans, SUVs, trucks, and commercial vehicles. Its flagship models include the Corolla (the world’s best-selling car), Camry, Land Cruiser, Hilux, RAV4 and Prius hybrid.

Toyota Land Cruiser Price in Pakistan 2025

Illustration 3: Toyota Land Cruiser is one of the most famous Toyota cars

The Toyota Motor Corporation owns several key brands:

  • Toyota (mainstream brand)
  • Lexus (luxury vehicles)
  • Daihatsu (compact cars and mini-vehicles)
  • Hino (commercial trucks and buses)

Toyota sells cars in all countries, but its biggest markets are asia and Japan.

Financial Highlights & Financial Performance | Shareholders & Investors  News | Toyota Motor Corporation Official Global Website

Illustration 4: Illustration of the biggest markets of Toyota


  • Electric and Hybrid Cars

Toyota has been a pioneer in hybrid technology since the launch of the Prius in 1997, the world’s first mass-produced hybrid electric vehicle. This bold move not only positioned Toyota as a technological leader but also sparked a global movement toward cleaner and more fuel-efficient vehicles. As of today, Toyota has sold over 20 million hybrid vehicles worldwide, contributing significantly to global CO₂ emissions reduction in the transportation sector.

Toyota’s hybrid portfolio is among the most comprehensive in the industry, spanning sedans, SUVs, and even commercial vehicles. Models like the RAV4 Hybrid, Corolla Hybrid, and Camry Hybrid continue to perform strongly in markets across Asia, North America, and Europe. Toyota is known for it’s longevity, quality and sustainability and it has proved that it can produce hybrid cars that are as solid as its gasoline cars.

Toyota teases slick electric sports cars in major EV preview - CNET

Illustration 5: Prototype of a new Toyota car that is to come out by 2026

In addition to hybrids, Toyota is expanding its presence in battery electric vehicles (BEVs). Under its new “bZ” (beyond zero) sub-brand, Toyota has launched the bZ4X, a fully electric crossover SUV, and plans to introduce over 10 new BEV models by 2026.

Toyota also produces hydrogen-powered cars as it intorduced Toyota Mirai, one of the few hydrogen-powered cars available to the public, in 2014. Toyota is also investing heavily in solid-state battery research. These next-generation batteries promise higher energy density, faster charging times and greater thermal stability, which could solve many of the limitations of current lithium-ion technology. Toyota aims to begin commercial production of solid-state batteries as early as 2027–2028, potentially reshaping the EV landscape.

  • Autonomous Driving, Robotics and AI

Under its innovation hub Woven by Toyota, the company is developing technologies for autonomous vehicles, smart cities, and connected mobility. Toyota’s Guardian system enhances driver safety through AI-driven assistive features, while its Chauffeur system aims for full autonomy in the future.

Toyota is also building Woven City, a fully connected smart city near Mt. Fuji to test smart infrastructure, robotics, and autonomous vehicles in real-life settings.

Beyond cars, Toyota is developing robotics for elderly care, manufacturing automation, and personal assistance. It has also invested in AI research, including partnerships with Stanford and MIT, and launched the Toyota Research Institute (TRI) to explore machine learning, robotics, and materials science.


Key Competitors

Toyota operates in one of the most competitive and rapidly evolving industries, facing rivals across traditional automaking, electric mobility, autonomous driving, and smart mobility ecosystems. Its competitors can be grouped into three main categories:

1. Traditional Global Automakers

  • Volkswagen Group: Toyota’s closest global rival by sales volume. Volkswagen has committed heavily to electrification, launching the ID. series of EVs and investing over €180 billion in digital and sustainable technologies. Its scale and global manufacturing footprint mirror Toyota’s, making the two firms frequent contenders in both developed and emerging markets.
  • General Motors (GM): Strong in North America and China, GM is transitioning aggressively to EVs under its Ultium battery platform and brands like Chevrolet, GMC, and Cadillac. GM’s Cruise division is also a key player in autonomous mobility.
  • Ford Motor Company: Ford competes in global markets, particularly in trucks, SUVs, and commercial vehicles. Its F-150 Lightning electric pickup and investment in self-driving (via Argo AI, now winding down) reflect its growing focus on innovation.
  • Honda: Fellow Japanese automaker and frequent rival in efficiency, reliability, and innovation.

2. Electrification and Mobility Disruptors

  • Tesla: As the world’s leading electric vehicle manufacturer, Tesla has redefined customer expectations in EV range, software, and direct-to-consumer sales. While Toyota is far ahead in hybrids and hydrogen, Tesla currently leads in BEV market share and autonomous software development.
  • BYD: China’s largest EV maker, BYD has quickly become a dominant force in battery-electric and plug-in hybrid vehicles. With vertical integration of battery and semiconductor manufacturing, BYD poses a strong challenge to Toyota’s market position in Asia and Latin America.
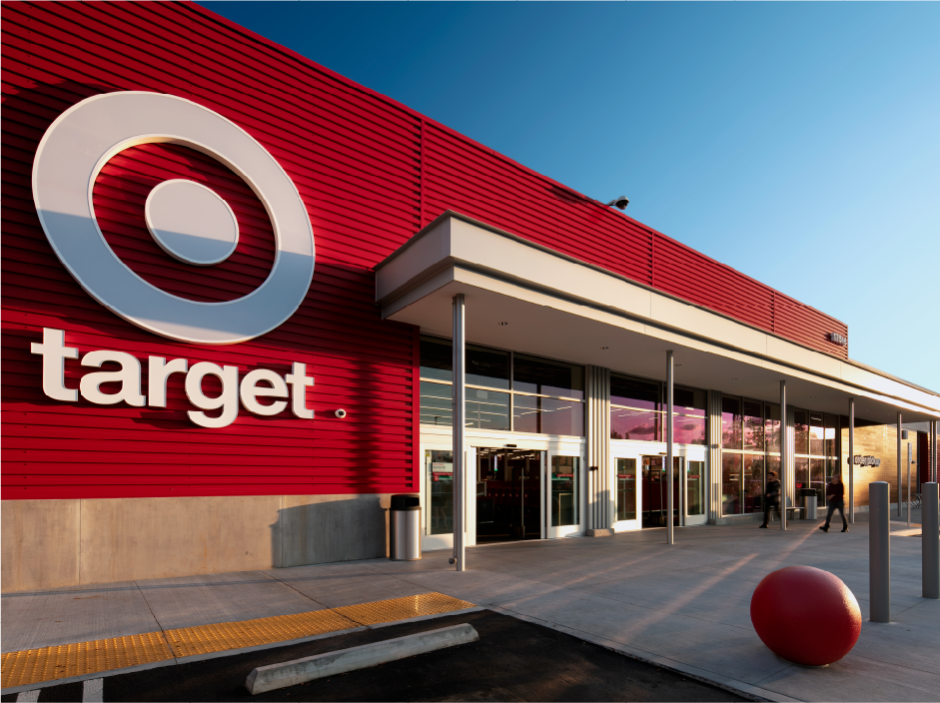
  • Hyundai-Kia: Rapidly growing with vehicles like the Ioniq 5 and EV6, the Hyundai Motor Group also invests heavily in hydrogen fuel cells, autonomous driving (via Motional), and design innovation. Hyundai’s ambition and product breadth increasingly rival Toyota’s.
Toyota reveals global sales in the first half increased 5.1% to 4.9 million  vehicles - Money & Banking Magazine

Illustration 6: A Toyota dealership


3. Tech Giants and AI Innovators

  • Apple and Google (Alphabet): Though not automakers per se, both companies are developing autonomous driving software and in-vehicle infotainment platforms. Google’s Waymo and Apple’s rumored “Apple Car” project symbolize the convergence of automotive and digital ecosystems.
  • NIO, XPeng, and Li Auto: Chinese EV startups are innovating rapidly in autonomous driving, digital UX, and direct sales models, supported by China’s strong EV policies.

Competitive Advantage

Toyota’s most defining advantage lies in its lean manufacturing and Kaizen culture. This system allows Toyota to produce high-quality vehicles with minimal waste and exceptional efficiency—offering a competitive edge in both cost control and scalability.

Its early leadership in hybrid technology has given Toyota unmatched experience in powertrain integration and fuel efficiency. Toyota’s scale, supply chain mastery, and reputation for reliability allow it to produce high-quality vehicles at competitive prices.

Rather than focusing solely on battery electric vehicles, Toyota has embraced a diverse electrification roadmap: hybrids, plug-in hybrids, BEVs, and hydrogen fuel cell vehicles. This approach gives Toyota flexibility across different markets and infrastructures, particularly in countries where charging infrastructure is underdeveloped.

Toyota is consistently ranked among the top brands for quality, safety, and long-term dependability. Its vehicles often command premium resale value and customer loyalty, helping sustain market share in competitive regions. Toyota invests heavily in R&D (over ¥1.2 trillion annually), with a focus on AI, robotics, connected mobility, and next-generation batteries. Its internal ventures like the Toyota Research Institute (TRI) and Woven by Toyota exemplify its commitment to transforming from a carmaker into a mobility technology company

2010 Toyota Prius Pricing, Photos & Specs

Illustration 7: Toyota Prius is a pioneer when it comes to hybrid cars

Future Outlook

Toyota is at a pivotal moment as the global auto industry transitions to electrification, autonomy and digital mobility. The company aims to sell 3.5 million battery electric vehicles annually by 2030, alongside continued leadership in hybrids and hydrogen.

Its investments in solid-state batteries, next-gen EV platforms and smart cities indicate a long-term strategy rooted in technological leadership and environmental responsibility.

As governments tighten emissions regulations and consumers demand cleaner, smarter mobility solutions, Toyota’s hybrid legacy, global reach, and evolving tech ecosystem position it as a mobility leader for the 21st century.


Stock Analaysis

In this section we will analyze Toyota’s stock to see if it is a good stock to buy or not. Our philosophy is value investing meaning that we try to find good quality companies that are undervalued. However, we will give a holistic overview so all kind of investors with different philosophies can judge the stock for themselves.

Revenue and Profits

Illustration 8 and 9: Revenue of Toyota Motor Corporation from 2009 to 2025

As shown in Illustrations 6 and 7, Toyota has maintained steady and consistent revenue growth from around USD 209 billion in 2009 to around 317 billion in 2025, without major spikes or declines. This smooth upward trajectory is a strong green flag, reflecting Toyota’s disciplined operations, global market balance, and long-term strategy.

Even through global disruptions like COVID-19 and supply chain challenges, Toyota’s lean manufacturing and diversified product mix helped it maintain growth. Its cautious but forward-looking investments in hybrids, EVs, hydrogen, and smart mobility have supported revenue expansion without volatility.

Overall, Toyota’s financial performance is a green flag for value investors as it shows a company that is stable, has increased its revenue steadily over time and been able to grow and handle crisis.

Illustration 10 and 11: Net Income of Toyota Motor Corporation from 2009 to 2025

Net income is a crucial metric to evaluate when determining whether a company is a worthwhile investment. It represents a company’s net profit or loss after accounting for all revenues, income items, and expenses, calculated as Net Income = Revenue – Expenses.

As seen in Illustrations 10 and 11, Toyota’s net income has followed a stable and upward trend from 2009 to 2025, closely mirroring its consistent revenue growth. Unlike many global automakers or tech firms, Toyota has avoided major profit volatility, thanks to its efficient cost structure, strong global demand, and disciplined investment strategy. This alignment between revenue and net income is a strong green flag, reflecting Toyota’s ability to innovate while maintaining healthy margins and financial stability.

Revenue Breakdown

Unveiling Toyota Motor (TM)'s Value: Is It Really Priced Right? A  Comprehensive Guide

Illustration 12: Revenue breakdown for Toyota Motor Corp. made by guru focus

As shown in Illustration 12, Toyota’s core automotive operations remain its largest revenue driver, consistently contributing over 90% of total revenue. This includes sales of passenger vehicles, commercial trucks, and parts across global markets. Toyota’s diverse portfolio, from the Toyota Corolla and RAV4 to Lexus luxury models and Hilux pickups, provides broad appeal across customer segments and regions. Its leadership in hybrid technology has been a key factor in sustaining strong vehicle demand and repeat sales.

In addition to vehicle sales, Toyota’s financial services segment, offering leasing, loans, and insurance, accounts for approximately 7.5% of total revenue. This arm supports the company’s retail strategy by providing in-house financing for customers and dealers in major markets like the U.S., Europe, and Japan. It also generates stable recurring income, even during periods of lower vehicle sales.

Emerging technologies and mobility initiatives, including hydrogen fuel cell systems, battery electric vehicles (BEVs), autonomous driving (via Woven by Toyota), and AI-powered mobility platforms, contribute a small but growing portion of revenue, currently estimated at 1.6%. While not yet significant in financial terms, these areas are central to Toyota’s long-term transformation strategy and have seen growing R&D allocation.

Toyota’s heavy investment in R&D, consistently around 8–9% of revenue, supports innovation in electrification, AI, robotics, and autonomous driving. While these initiatives contribute to short-term cost pressure, they are considered essential for maintaining technological leadership and complying with future regulatory standards.

In terms of profitability, Toyota maintains strong gross margins across its core business due to operational efficiency, economies of scale, and its renowned Toyota Production System (TPS). However, newer segments like BEVs and hydrogen mobility currently have higher development and production costs, which modestly impact overall margins as they scale.

Overall, Toyota’s revenue structure reflects both stability and forward-looking diversification. Its core business provides predictable cash flow, while its investments in next-generation mobility position the company for leadership in a rapidly evolving automotive landscape.

Earnings per Share

Illustration 13: Earnings per share for Toyota Motor Corp. from 2009 to 2025

Earnings Per Share (EPS) is a key financial metric that measures a company’s profitability on a per-share basis. It indicates how much profit a company generates for each outstanding share of its stock, and is used to assess a company’s financial health, profitability, and potential for growth. In other words this metric can tell us how profitable the business is.

The EPS figure itself isn’t the primary focus for value investors, it can be 0.2 or 10, but what truly matters is the company’s ability to generate consistent earnings growth. A steadily increasing EPS over time signals strong financial health, profitability, and long-term value creation.

Toyota’s earnings per share from 2009 to 2025 shows an increase over time from -2.88 in 2009 to 23.73 in 2025. This reflects a remarkable turnaround and long-term financial strength, driven by consistent global demand, operational efficiency through the Toyota Production System, and strategic investments in hybrid and next-generation mobility technologies. The steady growth in EPS highlights Toyota’s ability to generate sustainable profits even amid industry disruptions, regulatory changes, and rising R&D spending, positioning it as one of the most resilient and reliable companies in the global automotive sector and is a green flag for investors.

Assets and Liabilities

Illustration 14 and 15: Assets and Liabilities for Toyota from 2009 to 2025

When evaluating a company as a potential investment, understanding its assets and liabilities is crucial. If a local business owner offered to sell their shop to you, one of the first questions. after determining its profitability, would be about its equity and assets. The same principle applies when assessing publicly traded companies like Toyota.
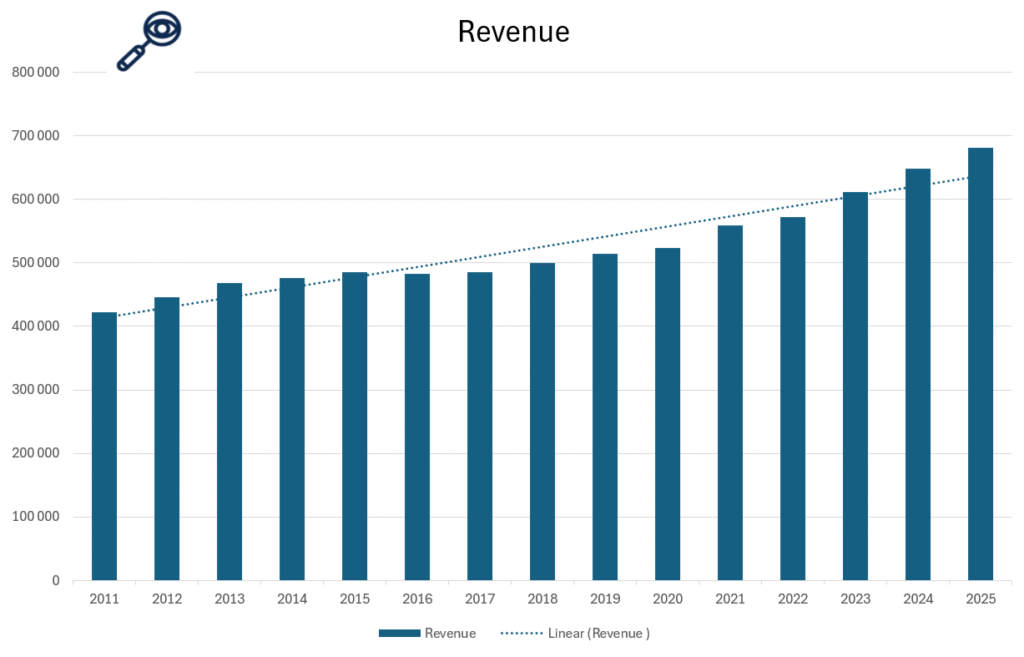
As shown in Illustrations 14 and 15, Toyota has built a substantial asset base, totaling approximately $621 billion in 2024. This steady asset growth from 2009 to 2024 is a strong positive indicator, reflecting the company’s ongoing expansion, long-term investments in electrification, autonomous technology, and manufacturing infrastructure.
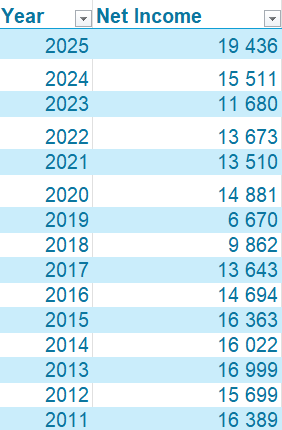
At the same time, Toyota’s total liabilities have also increased over the years, rising from approximately $193 billion in 2009 to over $378 billion in 2024. While this rise in liabilities may raise concerns for some investors, it is not necessarily a red flag, as much of it is tied to Toyota’s financial services arm and ongoing investments in electrification, autonomous driving, and next-generation mobility infrastructure. These capital-intensive areas are critical for maintaining Toyota’s global competitiveness and future readiness. Historically, Toyota has maintained a strong balance between investment and financial discipline, supported by robust cash flows and consistent profitability. Nevertheless, the scale of its liabilities warrants continued observation. Investors should monitor Toyota’s ability to manage debt responsibly, ensuring that it does not limit strategic flexibility or affect long-term financial stability as the automotive industry continues to evolve.

The key factor for investors is whether Toyota can effectively manage its debt while maintaining strong revenue and profitability. If the company can generate consistent cash flow and sustain high demand for its products and services, its rising liabilities may not be a major issue. However, if debt levels continue to grow faster than revenue or profits, it could indicate financial strain, making it important for investors to monitor the company’s ability to service its obligations while maintaining profitability.

Toyota’s cash on hand in 2024 is notably less than its long-term debt, which raises some concerns about its liquidity position. Holding less readily available cash compared to its debt obligations may indicate potential challenges in meeting short-term financial commitments without relying on additional financing or asset sales. This imbalance could limit Toyota’s flexibility to fund strategic investments or navigate unexpected market downturns, and investors should monitor the company’s cash flow management closely to assess any risks related to its financial stability. This should be monitored closely by all investors.

As seen in Illustration 15, Total Shareholder Equity, calculated as total assets minus total liabilities, has consistently grown over the past 14 years. This is a positive indicator for potential investors, as it suggests that Toyota is building value over time rather than eroding its financial foundation. A steadily increasing shareholder equity indicates that the company’s assets are growing at a faster rate than its liabilities, which is a green flag for financial health. This trend suggests that Toyota is successfully expanding its operations while maintaining a solid balance sheet. Additionally, rising equity provides a buffer against financial downturns, making the company more resilient in times of economic uncertainty. However, investors should also consider how this growth is achieved, whether through profitable operations or increased debt financing, to fully assess the sustainability of this trend.

Debt to Equity Ratio

Illustration 16 and 17: Debt to Equity ratio for Toyota Motor Corp. from 2009 to 2024

The Debt-to-Equity (D/E) ratio is an important financial metric for assessing a company’s financial leverage and risk. It compares the amount of debt the company uses to finance its operations relative to its shareholder equity. A high D/E ratio suggests that the company relies more heavily on debt to fuel growth, which could increase financial risk, especially during economic downturns when managing debt obligations becomes more challenging. In contrast, a lower D/E ratio indicates that the company is primarily financed through equity, reducing financial risk but potentially limiting its ability to rapidly expand.

Legendary value investor Warren Buffett generally prefers a debt-to-equity (D/E) ratio below 0.5. Toyota’s D/E ratio, however, stood at approximately 1.57 in 2024. TWhile this could raise concerns about Toyota’s financial leverage and its capacity to manage debt—especially amid industry shifts and economic uncertainties, it is not necessarily a red flag. Toyota has been strategically using debt to fund key investments in electrification, hydrogen technology, and autonomous systems, supporting its long-term growth ambitions. The downwards trend in D/E ratio is also a positive sign for investors as it indicates less reliance on debt financing over the years.

Price to earning ratio (P/E)

Illustration 18 and 19: Price to earnings ratio of Toyota Motor Corp. from 2010 to 2025

For value investors, one of the most critical metrics when evaluating Toyota’s stock is the price-to-earnings (P/E) ratio, as it helps assess whether the company is undervalued or overvalued. Even if a company has strong financials, purchasing its stock at a high price can lead to poor returns. For example, imagine a business generating solid profits of $1 million per year. If the owner offers to sell you the business for just $1, it would be an incredible deal. But if the owner asks for $1 trillion, even though the business is profitable, the price would be absurdly overvalued. The stock market works similarly, companies can be priced cheaply on some days and excessively expensive on others.

Warren Buffett, a legendary value investor, typically considers stocks with a P/E ratio of 15 or lower as “bargains.” A high P/E ratio suggests that investors are paying a premium for the company’s earnings, expecting significant growth. Toyota Motor Corporation has consistently maintained a relatively low P/E ratio over the years, hovering around 10 across multiple periods, as can be seen in illustration 18. This consistent valuation suggests a cautious but stable investor outlook, reflecting Toyota’s mature industry position and steady earnings performance. The current P/E ratio of 10.2 may signal that Toyota remains undervalued relative to the broader market. For value investors, this steady undervaluation could present an appealing entry point, especially if Toyota continues to perform reliably while transitioning to electric and autonomous vehicle technologies.

Price to Book ratio (P/B)

Illustration 20 and 21: Price to book ratio for Toyota Motor Corp. from 2009 to 2024

Price-to-book value (P/B ratio) is a financial metric used to compare a company’s market value (its stock price) to its book value (the net asset value of the company, calculated as total assets minus total liabilities). The P/B ratio is calculated by dividing the current share price by the book value per share. A lower P/B ratio suggests that the stock may be undervalued, as investors are paying less for the company’s assets than their actual worth. Conversely, a high P/B ratiomay indicate that the stock is overvalued, or that investors expect high growth in the company’s future earnings. The P/B ratio is often used by value investors to assess whether a stock is trading at a fair price based on its underlying assets. Legendary Investor Warren Buffet prefers company’s with P/B lower than 1.5 and often buys around 1.3 or lower.

The price-to-book (P/B) ratio of Toyota Motor Corporation is a green flag for value-oriented investors, as it has remained consistently low compared to industry peers and well within the range Warren Buffett often considers attractive. With a P/B ratio typically hovering around 1.0 or lower in recent years, Toyota appears undervalued relative to the net worth of its assets. This suggests that investors are paying a modest price for ownership in a company with strong tangible asset backing, healthy cash flows, and a proven global presence. Unlike tech companies with inflated P/B ratios driven by future growth speculation, Toyota’s low P/B reflects its stable earnings, conservative balance sheet, and disciplined capital allocation. For value investors, this consistency signals a potentially underappreciated opportunity, especially as Toyota ramps up its transition to electric and hydrogen vehicles, which could unlock new growth while maintaining financial resilience. Rather than indicating market pessimism, Toyota’s low valuation may simply reflect a longstanding investor tendency to undervalue traditional automakers, offering a chance for upside if the market re-rates its future prospects.

Return on Investment (ROI)

Illustration 22 and 23: Return on Investment for Toyota Motor Corp. from 2010 to 2015

For value investors, another essential metric when evaluating Toyota’s stock is Return on Investment (ROI), as it reveals how efficiently the company is using its capital to generate profits. In simple terms, ROI measures how much return a business earns relative to the capital invested to run it. Even if a company shows strong revenues, if it needs massive amounts of capital to produce modest profits, it may not be an attractive investment. For example, if one company generates a $100,000 return on a $1 million investment, while another earns the same return on just $500,000, the latter is clearly more efficient and potentially more valuable. ROI helps investors identify these distinctions and avoid companies that consume capital without delivering proportional returns. The higher the ROI, the better but it is also very industry dependent as some industries need a lot more capital than others. Legendary investor Warren Buffett has often stated that he seeks returns of at least 15% annually on his investments over time. While he doesn’t quote ROI specifically, this is effectively what he aims for in terms of return on invested capital and intrinsic value growth.

Toyota Motor Corporation has historically delivered a low but stable ROI, often ranging between 5% and 10%, which is considered healthy for a capital-intensive industry like automotive manufacturing. Even though, this is under Buffet’s expectations this is a normal ROI in the automaker industry which is very capital intensive. This consistent performance indicates that Toyota is effectively deploying its resources to generate returns, especially in comparison to peers in the same sector who may struggle with slimmer margins or capital inefficiency. As shown in illustration 21, Toyota’s ability to maintain solid ROI over time. despite economic cycles, supply chain disruptions, and shifts in consumer demand, demonstrates sound management and operational resilience. For long-term investors, this level of capital efficiency is a green flag, suggesting that Toyota is not just a stable company but one that continues to deliver meaningful returns without reckless spending, even as it invests in the future of mobility through electrification and automation.

Dividend

Illustration 24: Dividend Yield and dividend payout ratio from 2005 to 2025.

Toyota Motor Corporation has established itself as a reliable dividend payer in the global automotive industry, offering an annual dividend of approximately ¥60–¥70 per share in recent years. This reflects the company’s commitment to rewarding shareholders while maintaining financial discipline. Toyota’s steady dividend history—even through economic downturns—underscores its reputation as a financially stable, conservative company, making it a favorable choice for income-seeking investors.

However, there are considerations regarding Toyota’s dividend yield, which typically ranges between 2% and 3%. While the company continues to return capital to shareholders, growing demands for investment in electrification, autonomous driving, and sustainability initiatives could limit the pace of future dividend increases. As Toyota ramps up R&D and capital expenditures to stay competitive in a rapidly evolving industry, sustained dividend growth may face some headwinds if earnings growth slows.

Insider Trading

As a Foreign Private Issuer (FPI), Toyota is not required to file insider trading reports with the U.S. Securities and Exchange Commission (SEC). However, the company provides detailed disclosures in its annual reports and Form 20-F filings, which include information on executive compensation, shareholdings, and related party transactions.

Over the past years, Toyota Motor Corporation has not reported direct insider transactions involving its own shares. According to publicly available data and insider-tracking sources, the most recent direct insider transactions involving Toyota Motor Corporation’s own stock (NYSE: TM) date back to 2004.

This can be seen as both a red and a green flag for potential investors. It is a green flag as The absence of insider sales may suggest that Toyota’s executives have long-term confidence in the company and see no reason to cash out. Unlike many public firms where executives frequently sell stock, Toyota’s leadership appears more focused on stewardship than on short-term financial gains. Furthermore, In Japan, corporate culture traditionally emphasizes stability, loyalty, and modest compensation. Executives are less incentivized through stock grants compared to U.S. firms. This can reflect a conservative, shareholder-friendly philosophy where management is aligned with long-term success rather than short-term speculation.

However, The absence of insider purchases—even during market dips—may raise eyebrows. If executives truly believed the stock was undervalued at any point, why didn’t they buy? In the U.S., insider buying is often considered a strong bullish signal. Toyota is a Japanese company listed as an ADR (American Depositary Receipt) in the U.S., and insider trading disclosures aren’t held to the same real-time standards as in the U.S. This can lead to lower visibility and slower access to critical insider activity data, which some investors view as a governance downside. Toyota’s executive compensation is less tied to equity than U.S. firms, meaning insiders may not have “skin in the game” to the same extent. For some investors, this reduces alignment between management and shareholders.

Other Company Info

Founded in 1937, Toyota Motor Corporation is one of the world’s largest and most respected automotive manufacturers, known for its high quality and sustainable vehicles. As of 2024, Toyota employs approximately 375,000 people globally, reflecting its extensive operations in manufacturing, R&D, and mobility solutions. The company is publicly traded on the Tokyo Stock Exchange (TSE) under the ticker symbol 7203 which is its main listing, but it is also cross -listed on the New York Stock Exchange under the ticker symbol TM and operates within the Consumer Discretionary sector, specifically in the Automobiles industry.

Toyota is headquartered at 1 Toyota-cho, Toyota City, Aichi Prefecture, Japan. As of 2024, the company has approximately 3.2 billion shares outstanding, with a market capitalization of over $300 billion USD. For more information, visit Toyota’s official website: https://global.toyota.

Final Verdict

Toyota Motor Corporation is a solid long-term investment, especially for value and income investors. With consistently low P/E and P/B ratios, the stock appears undervalued compared to its history and peers. Toyota has a strong balance sheet, steady dividends, and a conservative payout ratio, making it reliable for income seekers.

The company is investing in hybrids, electric vehicles, hydrogen fuel cells, and autonomous driving, maintaining its global leadership with operations in over 170 countries. Although Toyota’s EV transition is slower than some competitors, its diversified approach could offer stability.

Overall, Toyota looks like a great opportunity for value investors. It seems undervalued, has solid financials and offers steady growth nad reliable dividends, making it an attractive choice for long-term investors focused on stability rather than rapid growth.

Page 1 of 3

Powered by WordPress & Theme by Anders Norén